Task 5: Compute a Forecast
Now you will create a forecast.
Create a New Forecast
- From Modeling tab, selecting New… from the Forecast menu.
- Set the time window options as shown below:
Forecast Time: 30Jan2024 at 0800 hours
Extract Start: 05Jan2024 at 0800 hours
Start Time: 05Jan2024 at 0800 hours
End Time: 07Feb2024 at 0800 hours - The name of the forecast and the description are automatically populated from the forecast time, but you can edit them. Name this forecast CAVI_Configuration.
- Select both the Forecast Runs you created to be included in the forecast.
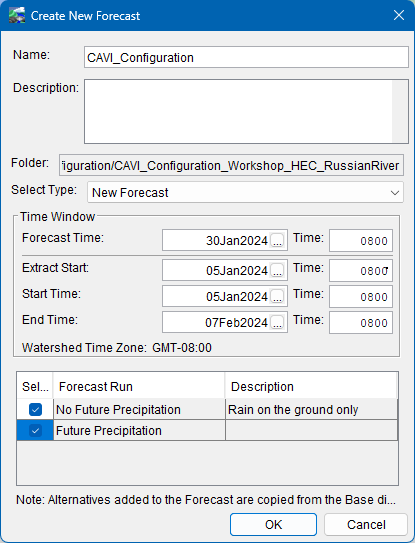
Verify your selections and press the OK button.
What processes are happening after you click OK?Prompted to select certificate alias and enter user pin (this is for the Cumulus Extract) A new directory for the forecast is created, the model alternatives are copied to that directory, and the extract groups are run to extract data into the forecast.dss file.
- Navigate the forecast directory to see the content of your new forecast.
Right-click the Name: at the top of the forecast panel and select Browse Forecast Folder.
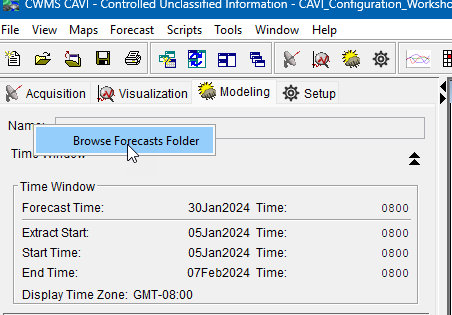
Where is this new forecast you created? Note some of the items in this directory.C:\CWMS_Class\forecast\CAVI_Configuration\CAVI_Configuration_Workshop_HEC_RussianRiver
A new directory with the forecast name was created, and within it another directory (the watershed name) containing all the forecast data.
- Review the Extract message tab and ensure the time series and gridded data records have been retrieved for the expected time windows of each extract group.
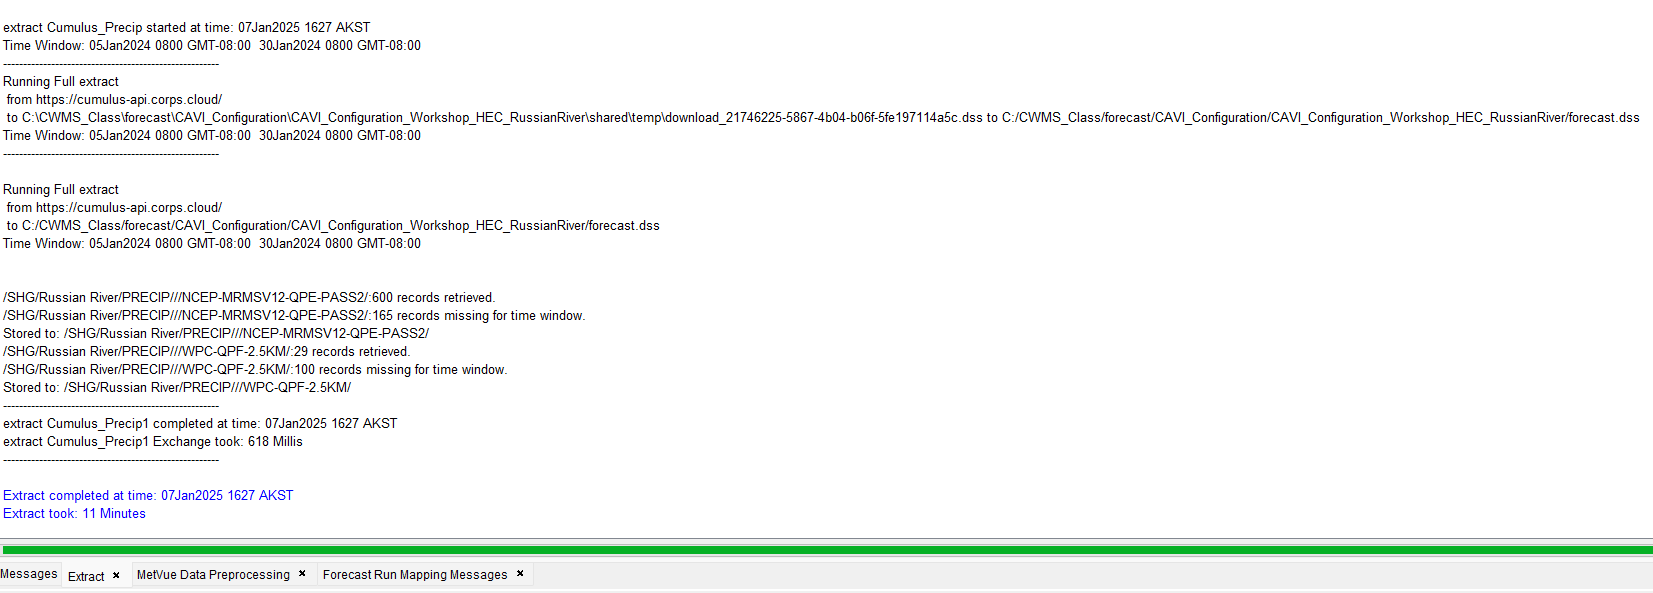
- Review the MetVue Data Preprocessing message tab to check on its status. HEC-MetVue data preprocessing is queued to automatically run, unless the data extract takes a long time. Then the HEC-MetVue preprocessing will time out in order to allow the extract to finish.

- If this situation occurs, simply click on the Reload Original Data button from the Actions tab for all the HEC-MetVue model alternative after the extract is completed.
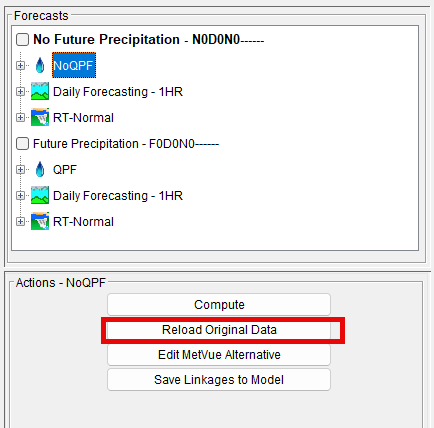
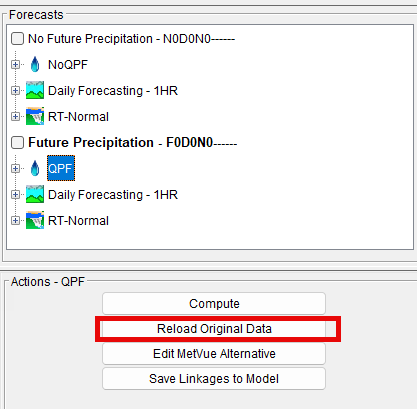
- If this situation occurs, simply click on the Reload Original Data button from the Actions tab for all the HEC-MetVue model alternative after the extract is completed.
Compute the Forecast Runs
- In the Forecasts panel, select the forecast run labeled No Future Precipitation by clicking on it within the list. The name will be highlighted by a blue background.
- Press the Compute button from the Actions tab.
- Once the compute completes, select the forecast run labeled Future Precipitation and click Compute.
- Did all of the models run successfully?
Compare the Results of the Forecast Runs
Now you will compare the results of the two forecasts.
- In the Forecasts panel, check the boxes next to the names of the two forecast runs. This will cause results from both forecasts to display in time series icons and in the HEC-ResSim output plots.
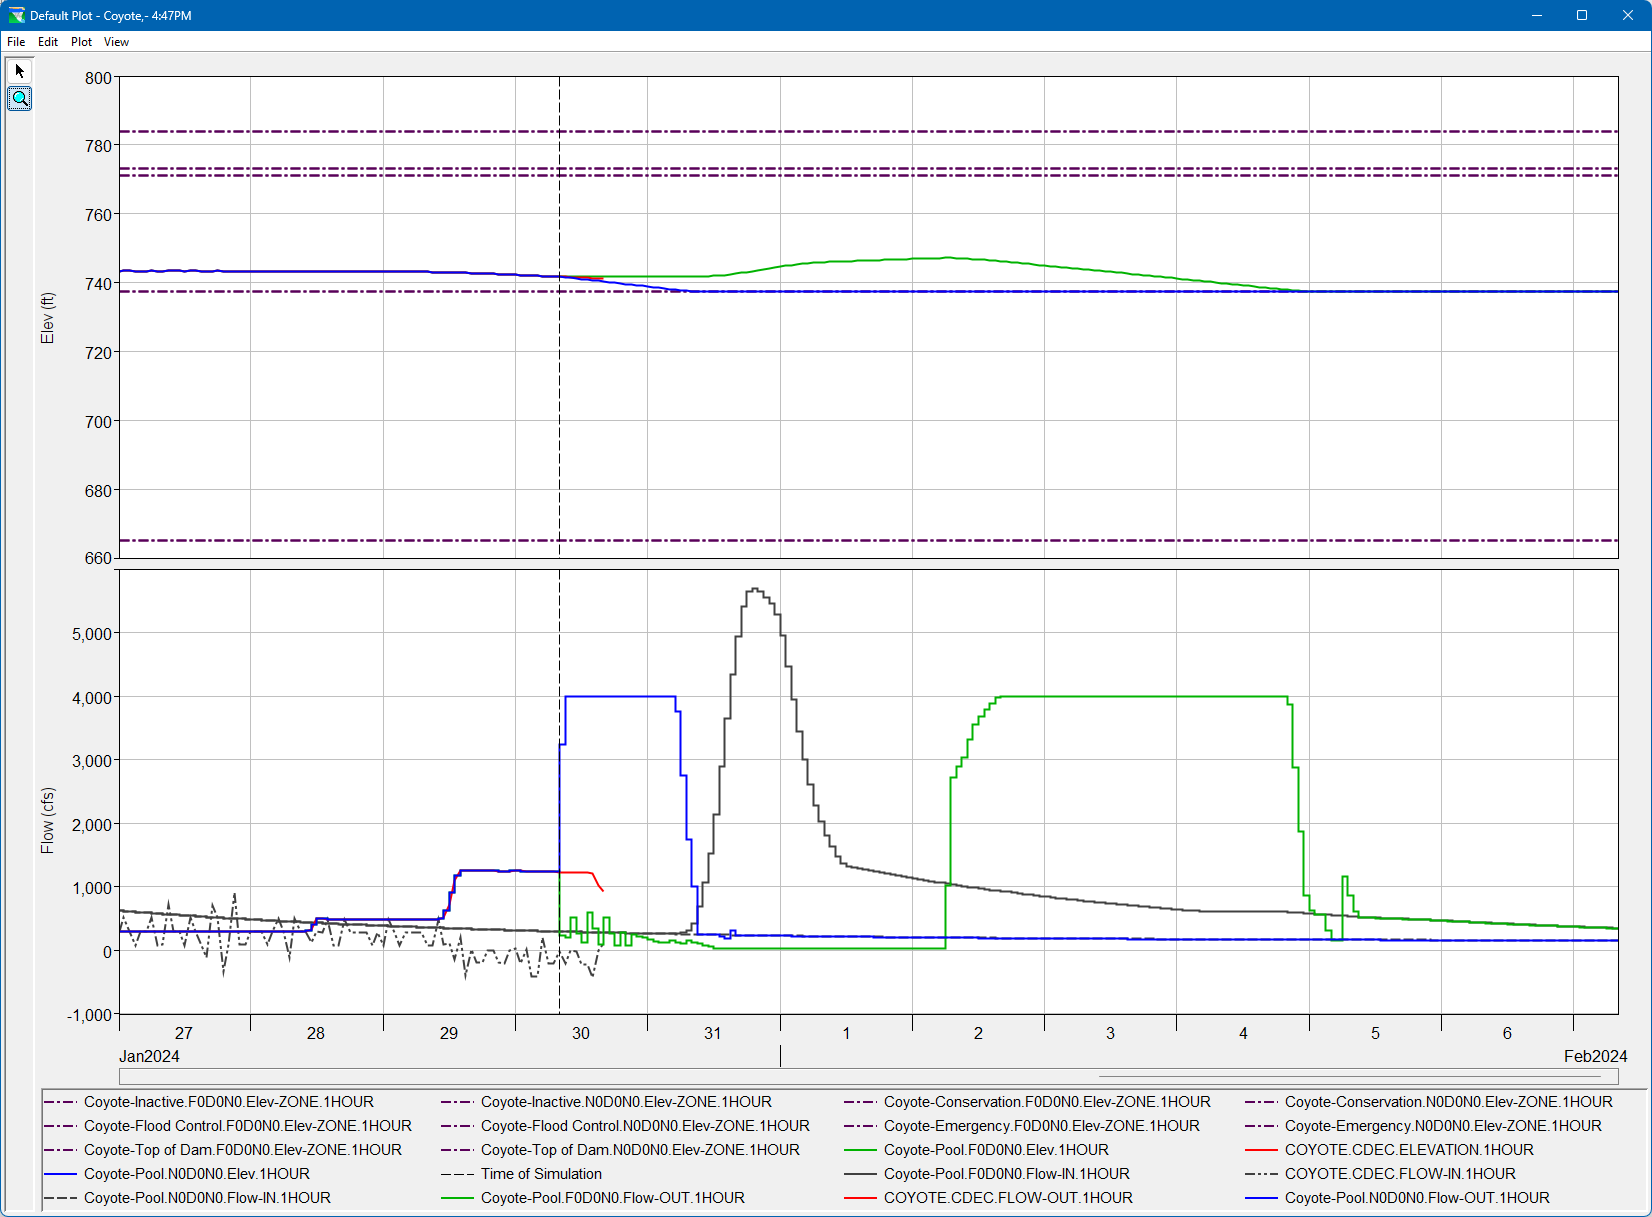
- Right-click on the Coyote reservoir (Lake Mendocino) model element from the map, You should see a context menu that gives you access to HEC-ResSim plots for the reservoir.
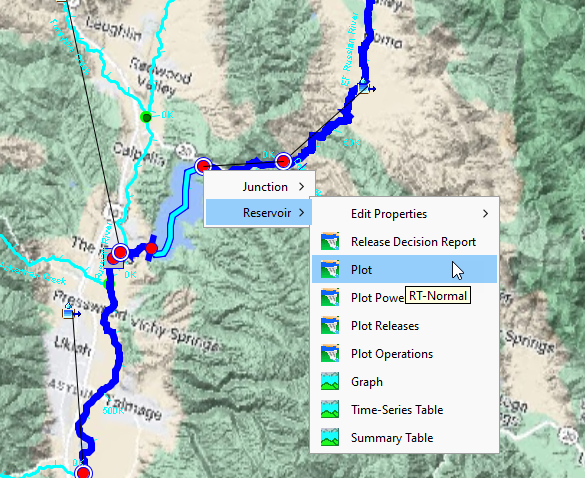
Select Plot from the menu. You should see the default reservoir plot for both forecast runs at this reservoir.
Enlarge the plot so that you can see the graphs clearly.
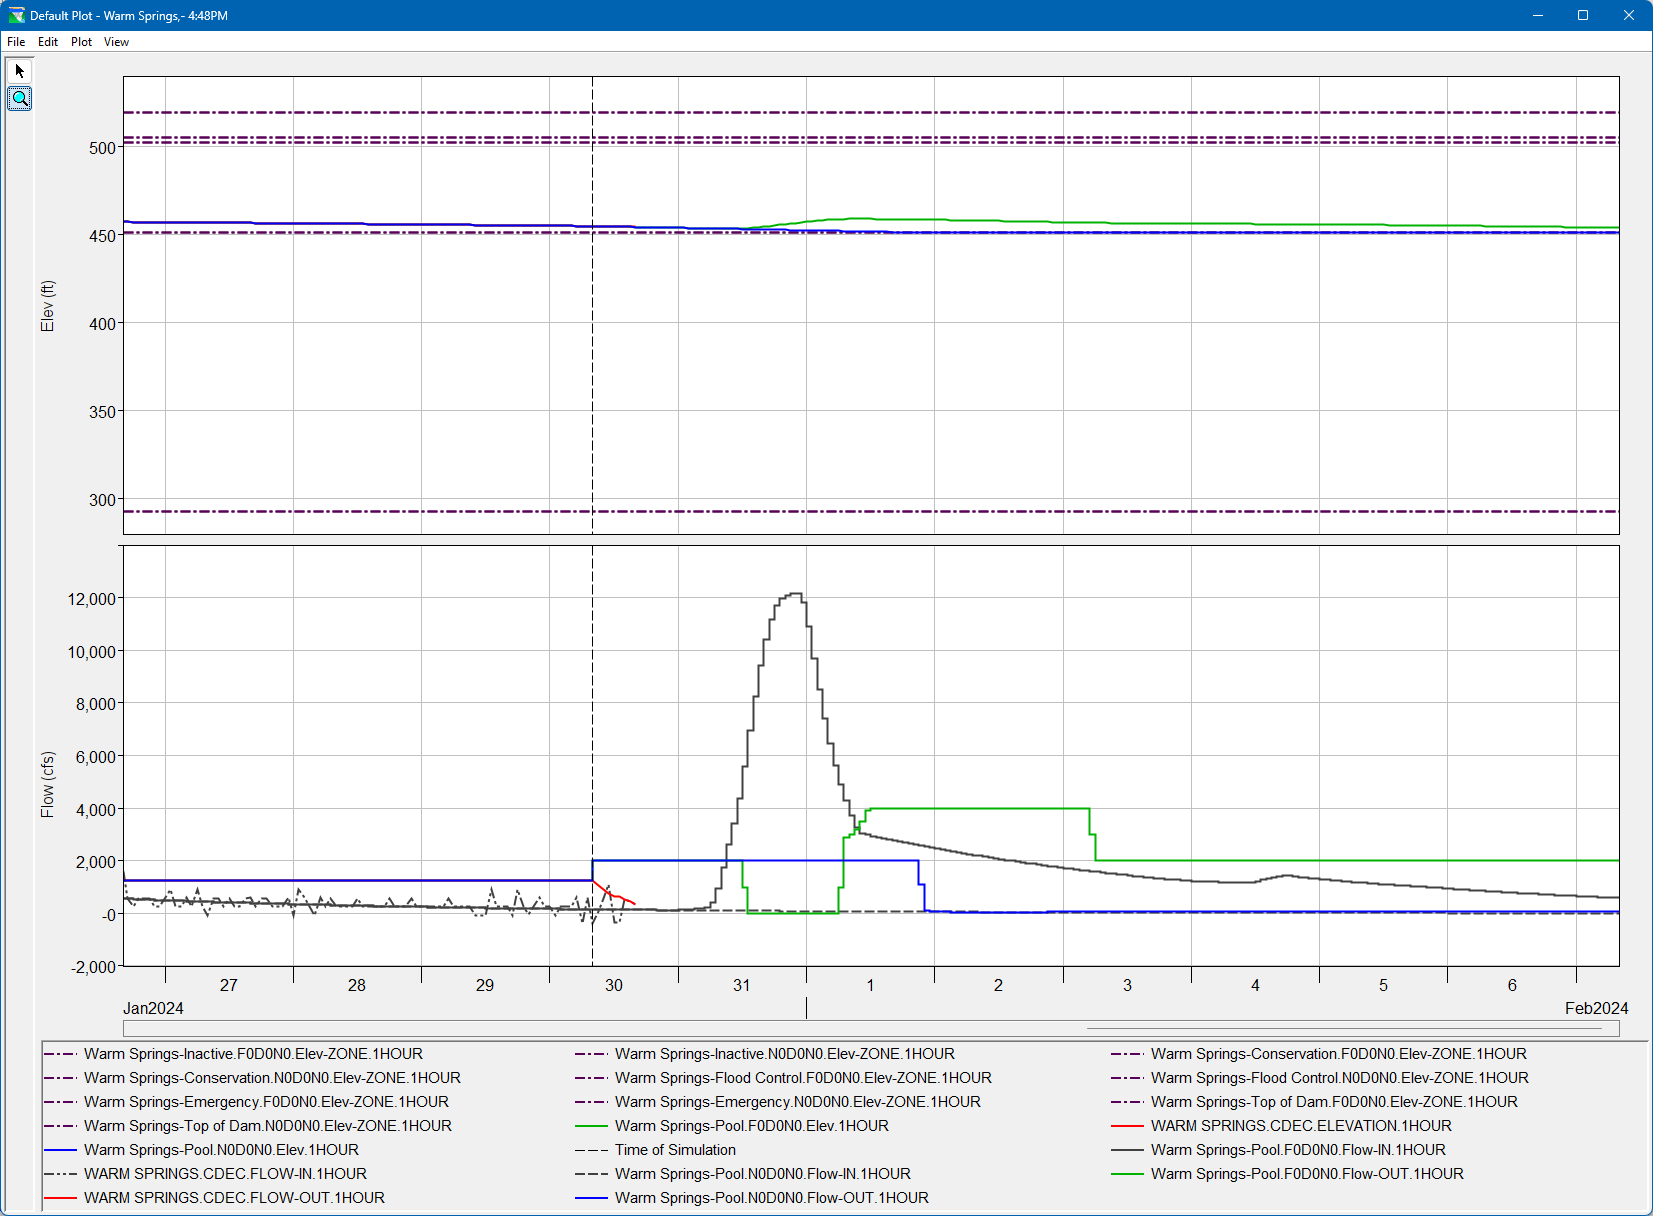
Similarly, review the HEC-ResSim results comparison plot for Warm Springs Dam (Lake Sonoma) model element.
What are you noticing in the comparison plots for the reservoirs? What impact does the forecasted rain have on the watershed?The forecasted rain in the QPF scenario produced additional inflows to the reservoirs. Delays in releases are also noticeable in the reservoir results plots, implying the forecasted rain also produced larger uncontrolled local flows downstream.
