Task 3: Reviewing HEC-FIA Results
Individual Structure Damages Report
From the Modeling tab, select the HEC-FIA alternative Real-time and click on the Reports tab.
Click the Individual Structure Damage Report button.
Once the report has opened, sort the structures according to inundation levels by clicking on the header of the Depth of Flooding column.
What structure experienced the deepest depth of flooding in this scenario?Structure Name RES1-1SNB 40903 was flooded to a depth of 6.88 ft.
- The easiest way to locate a specific structure in the Map Window is to use the HEC-FIA user interface. Launch HEC-FIA by clicking on the HEC-FIA icon.

- Once the HEC-FIA model has loaded, expand the study tree by double-clicking on the Workshop_HEC_RussianRIver. If no map window is showing, click on the Window menu and select the Tile option.
- Add an internet map by right-clicking on the Map Layers item in the study tree and selecting Add Internet Map.
- Select the Maps tab at the bottom, right-click on Internet Map and select Move To Bottom.
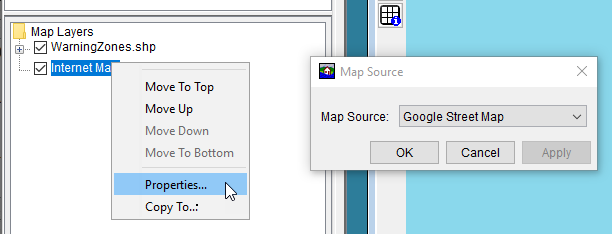
- Change the internet map to display the Google Street Map by right-clicking the Internet Map, selecting Properties, and choosing Google Street Map as the source.

- Return to the Study tab and expand the Inventory tree item.
- You should now see a Structure Inventories node. Expand it.
- You should see a Parcel-based item - that is your structure inventory. Right-click on it and select Display in Map Window.
- Now, right-click on Parcel-based and select Edit>Form Editor. This will bring up the Structure Editor dialog.
- Press CRTL+F to open the find function. Type in a unique part of the name of the structure you are trying to locate (i.e., 40903), then press Find. The form editor will now have that structure (RES1-1SNB 40903) selected.
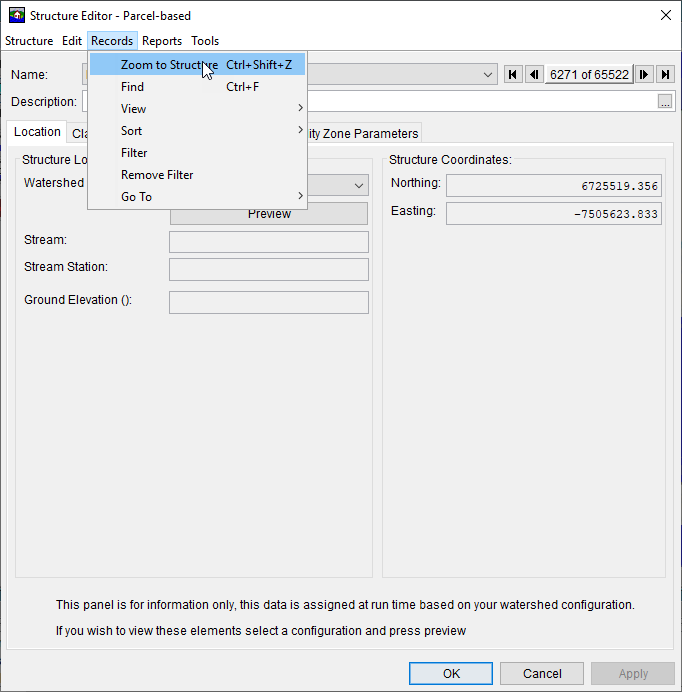
- Click Records>Zoom to structure and the map window will zoom in on this structure.

Comparing the placement of the structure to the street map, is the depth at the structure reasonable?
Yes, based on the the depth at the structure looks reasonable. The structure is directly adjacent to the Russian River. To verify this, one could open RAS Mapper and look at the depths in the vicinity of the structure. You could also load the depth grid as a raster layer in HEC-FIA and use the grid query tool to view the depth around the structure. If the structure location is deemed to be incorrect it can be modified in a GIS program and the inventory re-imported into HEC-FIA.
Besides the river elevation, the depth is also a function of the ground elevation. The circumstances of the terrain cell-size and placement of the shapefile point within the structure footprint can add significant uncertainty to the simplifying assumptions built into the HEC-FIA computations, especially in sloped areas.

Aggregated Consequences Report
Close HEC-FIA and return to the Modeling tab in the CAVI.
- Select the Real-time HEC-FIA alternative and then select the Reports tab.
Click on the Aggregated Consequence Damages button. This report aggregates consequences using Emergency Planning Zones, Boundaries, or other elements stored in the results .dbf files. If you load boundary shapefiles into the HEC-FIA alternative, such as county borders, you can also use those shapefiles to aggregate impacts. The default aggregation is by Emergency Planning Zone.
Use the report to determine which Emergency Planning Zone had the greatest content damage. Next, determine the Emergency Planning Zone with the greatest total damages.
Guerneville had the greatest content damage and total damage for this forecast scenario.
Using the View By drop-down box to group by Damage Category, which sector had the greatest life loss?
Switching to the Life Loss tab, you can see that the Residential category had the greatest life loss. Total life loss equals the sum of each of the Life Loss columns (Life Loss Day Under 65, Life Loss Day Over 65, Life Loss Night Under 65, and Life Loss Night Over 65).
Which occupancy type had the most life loss?
Changing the View By option to Occupancy Type, you can see that RES1-1SNB had the most life loss in this scenario.
Which zone had the least number of structures flooded?
Switching to the Structure tab, you can see that Mendocino only had 1 structure flooded. (Make sure to change the View By option back to Emergency Planning Zone.)
Critical Infrastructure Report
From the Reports tab, select the Critical Infrastructure button to view the Critical Infrastructure Report. This report only shows infrastructure elements that were inundated above the ground elevation defined by the terrain or by the user.
Was the WTRS_WASTE_TREAT_PLT_0000 flooded in this event? What critical infrastructure element experienced the deepest amount of flooding?Yes, the Waste Water Treatment Plant was flooded. The greatest flood depths occurred at the PUBV_Campground_004.
Impact Response by Location Report
From the Reports tab, select the Impact Response by Location button to view the Impact Response graph for Guerneville. The HEC-RAS River Station for Guerneville is Russian DCToOcean-15.5.
Would this event close Highway 116 at Drake Road (see rule for Guerneville Flood Stage)? Was a flood stage exceeded at any of the three gages? Which came first?Yes this event was forecasted to flood the intersection of Highway 116 and Drake Road at 11:52 on 09Jan2017
Hopland would reach Flood Stage at @17:08 on 08Jan2017 .
Healdsburg would not exceed Flood Stage.
Hopland would exceed Minor Flood Stage first @ 17:08 on 08Jan2017 .
Detailed Life Loss Report
From the Reports tab, open the Detailed Life Loss Report by clicking the Life Loss button.
Expand the tree by clicking on the + symbols next to each of the folders.
If the event occurred during day-time, what would be the Population At Risk of people over 65? How many people total received the flood warning but failed to mobilize? Did any of the scenarios result in life lost while caught evacuating?The Daytime (2 PM) PAR of people over 65 would be 184.
Zero people over 65 received warning but then failed to mobilize.
No one died while evacuating.
Current Task:
Next Task(s):