Working with Time Series Icon Layers
Time Series Icon Layers help organize sets of time series icons on the map, making it easier to view and manage data. You can create multiple layers to separate icons by data type, location, or function.
This guide explains how to work with the layers, including creating new layers and configuring their properties.
Creating Time Series Icon Layers
There are two ways to create new Time Series Icon layers:
- Using the Map Layers Dialog
- Using the Time Series Icon Editor Dialog
Using the Map Layers Dialog
To use the Map Layers Dialog to create a new layer:
- In the Setup tab, go to the Maps menu and select Map Layers. The Map Layers dialog will open.
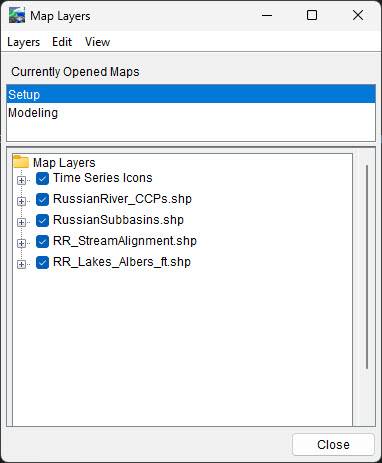
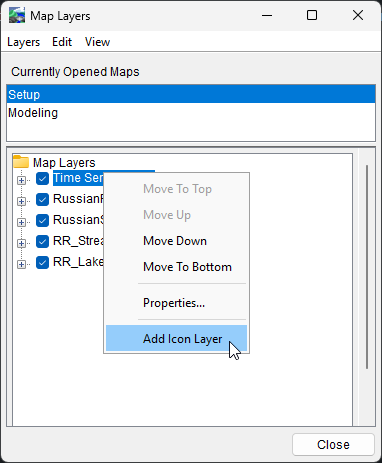
- In the Map Layers tree, right-click the Time Series Icons layer and select Add Icon Layer.
- In the New Time Series Icon Layer dialog:
- Enter a name for the new sub-layer in the Name field.
- Optionally, add a description in the Description field.
- To automatically include all time series icons defined for the watershed, check Add all Time Series Icons' Data Sets to this Layer. (To add icons individually, see the Adding Data to Time Series Icons section.)
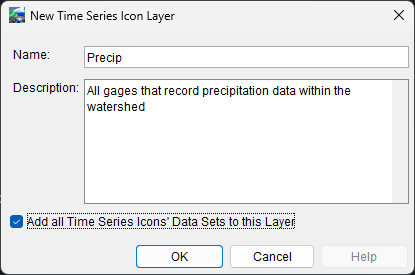
- Click OK to create the layer and close the dialog.
Using the Time Series Icon Editor
To use the Time Series Icon Editor to create a new layer:
- In the Setup tab, right-click a time series icon in the map window and select Edit.
- In the Time Series Icon Editor, go to the Icons Types and Layers tab.
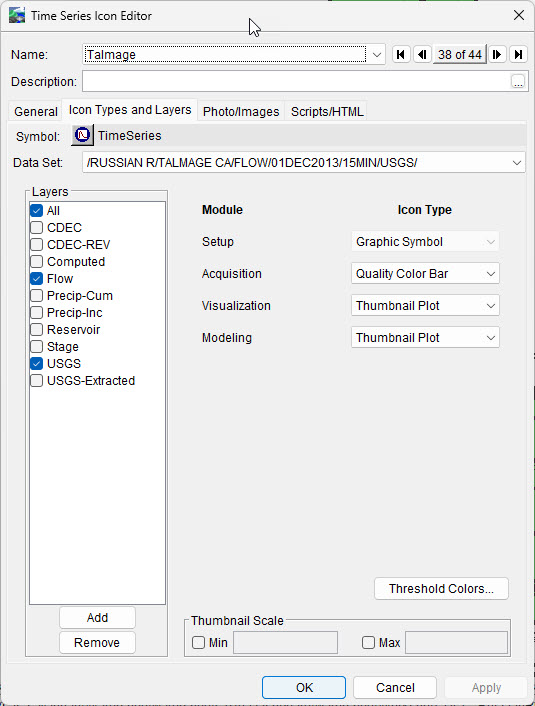
- Click the Add button in the lower-left corner of the window. The New Time Series Icon Layer dialog will open.
- Complete the fields as described above, then click OK.
Configuring Time Series Icons Layer Properties
HEC-RTS allows you to configure the appearance of time series icons, their labels, the visualization scale, and associate a template using the Time Series Icon Layer Properties dialog.
Accessing the Properties Dialog
To access the Time Series Icon Layer Properties Dialog:
In the Map Layers tree, right-click on Time Series Icons
Select Properties from the shortcut menu. The Time Series Icon Layer Properties dialog will open.
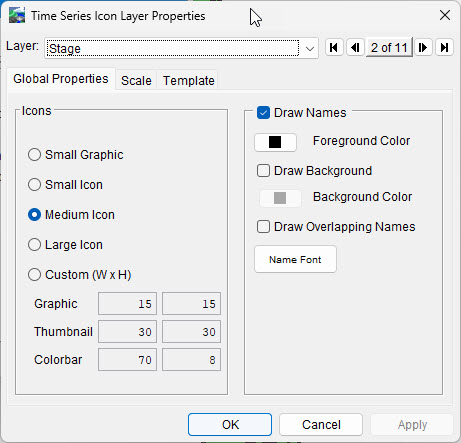
The Layer dropdown list will display:
Time Series Icons (if no sub-layers are defined), or
The name of each defined time series icon layer.
Global Properties Tab
The Global Properties tab allows you to adjust the appearance of all time series icons and their labels for the selected layer (from the Layer drop-down) in the Visualization and Acquisition modules. Changes made here will not affect the map windows in the Modeling and Setup modules.
Icon Size
By default, time series icons use the Medium Icon format. HEC-RTS offers five display options for time series icons:
- Small Graphic
- Small Icon
- Medium Icon
- Large Icon
- Custom
Displaying Labels
By default, time series icon labels are displayed in the map window. To hide the labels for a specific layer, uncheck Draw Names and click Apply. The labels will no longer appear in the map window.
If some labels are missing when viewing the entire watershed due to overlap, check the box next to Draw Overlapping Names and click Apply. This will ensure that all labels for the time series icon layer appear, even when the map shows the entire watershed.
Label Colors
To change the color of the layer’s labels:
- Click Foreground Color. The Choose a Color dialog will open.
- Choose your desired color and click OK to apply.
To add a background color to the labels:
- Check the box next to Draw Background and click Apply. This will give the labels a light gray background by default.
- To customize the background color, click Background Color.
- Choose your desired color and click OK to apply.
Fonts
To change the font of the labels:
- Click Name Font to open the Font Chooser.
- Select the font type, size, and any other desired styles (e.g., bold or italic).
- Click OK to apply the changes.
Scale Tab
The Scale tab lets you define the zoom level at which a time series icon sub-layer becomes visible.
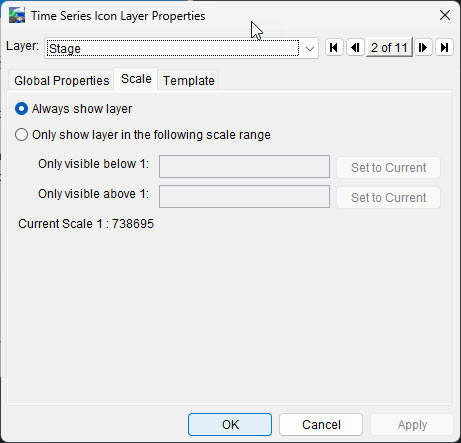
There are two options available:
- Always Show Layer - If selected, the layer will always be visible, regardless of the map’s zoom level.
- Only Show Layer in the Following Scale Range - If selected, you can set the layer to appear only within a specific zoom range. You can specify:
- Below a certain scale
- Above a certain scale
- Both ranges
You can either enter the scale manually or click Set to Current to match the current zoom level.
Template Tab
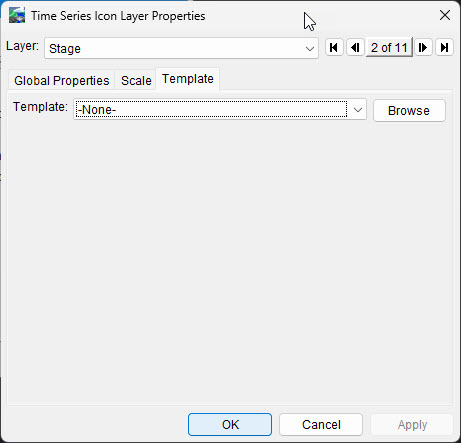
Templates save custom plot settings, which can be applied to plots and Time Series Icons Layers.
To associate a template with the layer:
Go to the Template tab.
Select a template from the Template drop-down list, or click Browse to navigate to a template file.
Removing Time Series Icons Layers
To remove a Time Series Icon layer:
- In the Setup module, right-click a time series icon in the map window and select Edit.
- In the Time Series Icon Editor, go to the Icons Types and Layers tab.
In the Layers list, select the layer you want to remove.
Click the Remove button in the lower-left corner.
A warning message will appear asking you to confirm the deletion. Click Yes to confirm, and the layer will then be removed from the list for all time series icons.