Download PDF
Download page Graphical Editing Area.
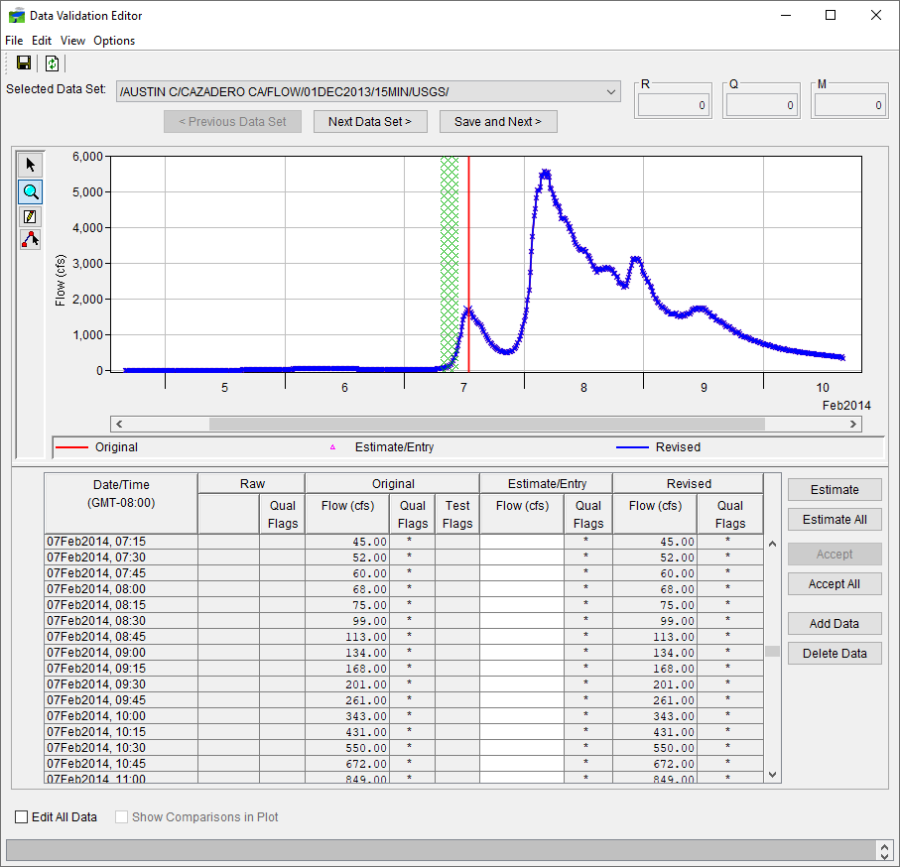
Graphical Editing Area
The graphical editing area displays the selected data set graphically. By default, a blue line represents data values that have been validated and transformed (i.e., revised data), and a green line represents data values received directly from the data streams (i.e., raw data).

By default, the data shown in the plot scales so that all raw data and validated/transformed data are visible in the plot, this is because raw data can contain erroneously large or small data values. If you clear Scale Plot to Raw Data from the Options menu (Data Validation Editor), the plot window will scale to validated/transformed data, potentially leaving any raw data beyond the validated/transformed value bounds outside of the plot window.
The data that is visible in the tabular data area is highlighted as a green-hatched column in the graphical editing area. A vertical black line in the graphical editing area or running through the green-hatched column in the graphical edit area indicates the specific record in the tabular data area you have selected.
Graphical Editing Tools
The graphical editing tools available from the Data Validation Editor allow you to view and edit data in the graphical editing area. The available tools are:
![]() Pointer/Selector Tool
Pointer/Selector Tool
The Pointer/Selector Tool allows you to navigate in the graphical editing area and move quickly through a large data set. Select one data point then hold the shift key and select another point in the graphical editing area to select a range of data points.
![]() Zoom Tool
Zoom Tool
The Zoom Tool allows you to magnify specific sections in the graphical editing area. To use the Zoom Tool, click and drag a rectangle around the area to be magnified. If you need to zoom out, right-clicking repeatedly will progressively reverse the zoom magnification.
![]() Single Point Edit Tool
Single Point Edit Tool
The Single Point Edit Tool allows you to select an individual or a range of data points ![]() , execute estimates
, execute estimates ![]() , and to set quality flags in the graphical editing area.
, and to set quality flags in the graphical editing area.
![]() Multi-Point Edit Tool
Multi-Point Edit Tool
Using the Multi-Point Edit Tool, you can edit data by drawing new plot lines in the graphical editing area.
Shortcut Menus
You can customize the appearance of the graphical editing area by using several properties editors. These properties editors are accessed by right-clicking on the different elements of the plot, and from the shortcut menu, clicking Edit Properties.

The available shortcut menus and properties editors are listed below:
| Polygon Properties | This editor will allow you to customize borders and backgrounds of the green-hatched column in the graphical edit area (G2dPolygon shortcut menu). |
| Viewport Properties | This editor will allow you to customize the border, background, and gridlines of the graphical edit area, and also add markers (Viewport shortcut menu). |
| Axis Properties | This editor will allow you to customize the axis scale, tic marks, and axis type (Axis Tics and Axis Labels shortcut menus). From this editor, you will be able to view the axis label, change the font, alignment of the axis title, add a border, and add color (Axis Label shortcut menu). |
| Legend Properties | This editor will allow you to move the legend to the right of the plot or to the bottom of the plot, or hide the legend (Legend Panel shortcut menu). |
| Curve Properties | This editor will allow you to edit various properties of the displayed curves in the Data Validation Editor (Curve Name shortcut menu). |
| Specific Record Properties | This editor will allow you to customize the vertical red line that indicates the specific record in the tabular data area of the Data Validation Editor that you have selected (ScrollView Data shortcut menu). |