Deterministic Simulation Results
The results obtained from a deterministic simulation can be accessed through the Results menu, through the individual simulation shortcut menu (review Managing Simulations), through the Content Pane, or graphically through the map window. Results are created and stored by the plugins or their constituent software applications (e.g. HEC-RAS). Results are stored in the simulation.dss file or in the constituent software application's own folder. Results are presented by the plugins on behalf of the constituent software application. Therefore, the results that are made available are the responsibility of the plugin developers and represent the results that the plugin developers believe are most important within the context of a deterministic application of their software within HEC-WAT. For details on how to interpret the specific results, be sure to leverage the documentation for the plugins or their constituent software applications (review the HEC-WAT Plugin Documentation).
The examples described in this section are included to give a general description of how to view deterministic results; however, specific results available to a user depend upon the program order and underlying model alternatives utilized in the simulation.
Results Menu
From the HEC-WAT Results menu in the HEC-WAT main window, the user can access results from the different plugins in the simulation's compute sequence. Select the plugin (e.g., HMS) for which results are desired and select the <report name>-<model alternative name> (e.g., Global Summary Table - (RUN)Feb_1986).

For example, if the HEC-HMS model alternative results are desired, point to HMS and click Global Summary Table-(RUN)Feb_1986. The Global Summary Results for that particular HMS model alternative displays. The summary table is a native summary table that is generated by HEC-HMS provided by the HEC-HMS plugin and accessed through HEC-WAT.

For HEC-RAS, from the Results menu, point to RAS, the sub-menu provides a list of available HEC-RAS results from which the user can select.
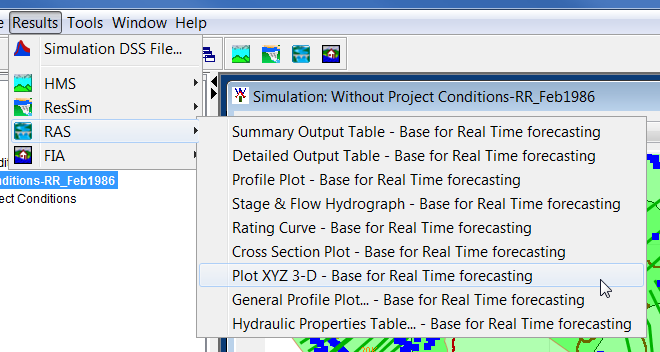
For example, from the RAS results sub-menu, click Plot XYZ 3-D - Base for Real Time forecasting, and the X-Y-Z Perspective Plot for the Base for Real Time forecasting plan dialog box opens.

Content Pane
Once a simulation has been computed, the user can review the same reports that are available from the Results menu, from the Content Pane. From the Content Pane, right-click on one of the available model alternatives (e.g., the HEC-ResSim model alternative, calibrate), and from the shortcut menu, point to Results, and click on the desired results (e.g., Flow Summary).
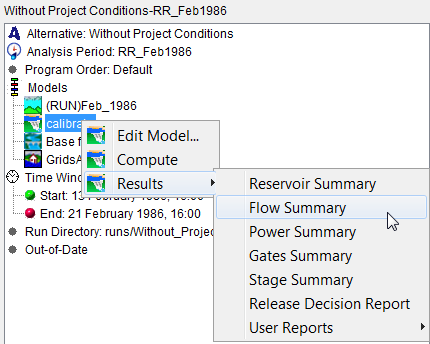
For example, from the Content Pane, right-click on the ResSim calibrate model alternative, point to Results, and click Flow Summary from the sub-menu. The Flow Summary Report dialog box opens for the calibrate model alternative.

Another example from the Content Pane: right-click on the HEC-FIA GridsAndXSecsAlternative model alternative and point to Results. The sub-menu provides a list of available HEC-FIA results from which the user can select.

For example, point to Results, click Individual Structure Damage Report, and the Individual Structure Damage Report dialog box opens.

Simulation Map Window
Results from the simulation map window are available by right-clicking on schematic elements and selecting results items from the shortcut menu (zooming in on an area is a good idea). From the map window click the Pointer Tool ![]() , right-click on a schematic element, and a shortcut menu appears. The shortcut menu provides information about all graphic elements that are near the mouse click. For the example provided below, the graphic elements near the mouse click include a junction, an impact area, a routing reach, and cross sections. Further, the example image displays the results option (e.g., Aggregated Consequence Report) for an HEC-FIA impact area in the GridsAndXSecsAlternative FIA model alternative.
, right-click on a schematic element, and a shortcut menu appears. The shortcut menu provides information about all graphic elements that are near the mouse click. For the example provided below, the graphic elements near the mouse click include a junction, an impact area, a routing reach, and cross sections. Further, the example image displays the results option (e.g., Aggregated Consequence Report) for an HEC-FIA impact area in the GridsAndXSecsAlternative FIA model alternative.

In the example, right-click on an impact area from the schematic, from the shortcut menu, point to Impact Area, and click Aggregated Consequence Report. The HEC-FIA Aggregated Consequence Report opens. Click the Life Loss tab to get a Life Loss Report by impact areas.

For the same example location, from the shortcut menu point to Reach. The sub-menu lists all the available results from the models in the compute sequence that include routing reaches in their analysis (hydrologic, hydraulic). Each software application that has results is represented by the icon for each software application. For the example provided below, the Reach sub-menu lists result options for the HEC-RAS Base for Real Time forecasting model and the HEC-HMS (RUN)Feb_1986 model.

For the reach example, if the user wants to view the computed profile for a particular HEC-RAS hydraulic routing reach, click Profile Plot from the Reach sub-menu. The HEC-RAS Profile Plot displays for the Base for Real Time forecasting plan.

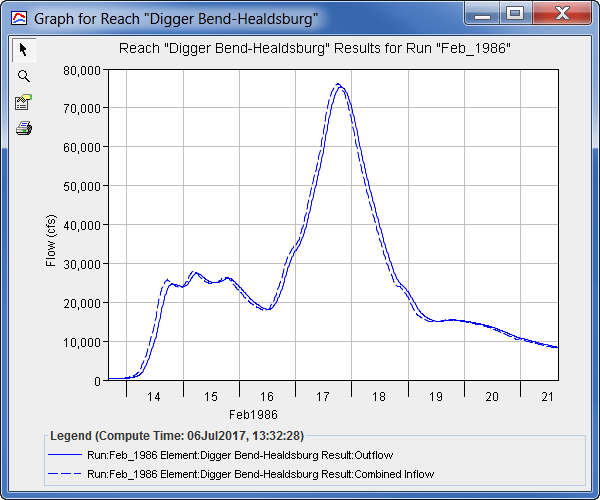
Another reach example for the same location: from the Reach sub-menu, click Graph to view the computed hydrograph for an HEC-HMS hydrologic routing reach. The Graph for Reach for the (RUN)Feb_1986 HMS run displays.