Download PDF
Download page Scripting Time Series and Plots.
Scripting Time Series and Plots
GENERAL NOTES:
- Reference the indicated lecture slides and/or links as necessary.
- When using links you may need to search for the method names.
- Remember that scripts are case sensitive, so pay attention to upper and lower case.
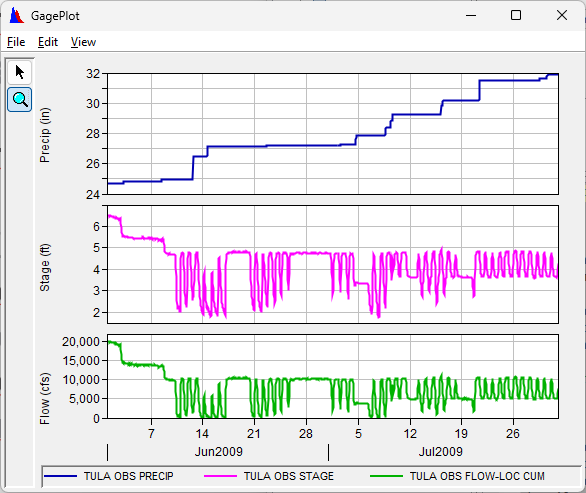
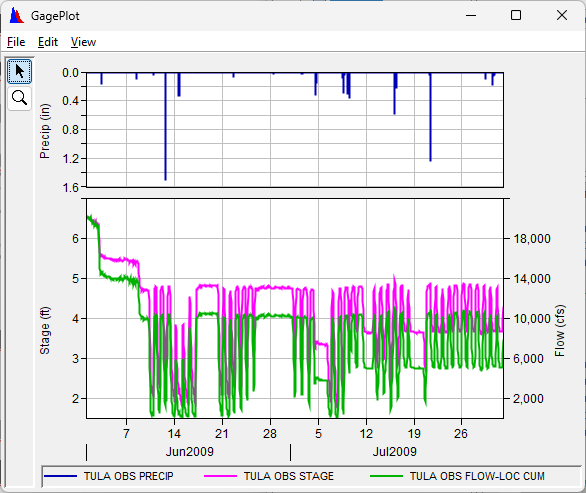
Task 1. Create a Simple Stream Gauge Plot.
- Start HEC-DSSVue if it is not already executing on your computer.
- Launch the Script Editor by selecting Tools→Script Editor from the menu.
- Create a new script named "GagePlot" using the File→New Menu.
- Enter "GagePlot" for the label
- Notice that DSSVue added some common import statements to the script already.
- Open the GagePlot.txt file from the workshop directory using Notepad.exe or a similar program.
- Copy the text from this file and paste it into the Editor Pane, replacing the automatically added import statements.
- Verify that the path to the filename is pointing to the ScriptingWorkshop.dss file
(e.g., dssFilename = "C:/Class/DSS/DSSVueScriptingWorkshop/ScriptingWorkshop.dss") - Replace the comments that begin with the string "###" with code that performs the actions described in the comments.
• Be sure to replace the entire comment (e.g., ### open the file named by variable dssFilename) on each line with code.
• All strings (except "GagePlot" for the plot title) have been assigned to variables to use in the various methods.- Highlight all occurrences of "###" in the script.
- Click anywhere in the editor pane and press Ctrl-F (or select Edit→Find... from the menu bar) to lanuch the Find dialog.
- Enter ### in the Find What: field
- Click the Find Next button.
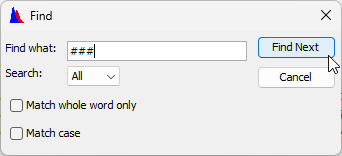
- Click the Cancel button.
All occurrences of "###" in the script are now highlighted, and you can press F3 to move to the next occurrence.
To move to the first occurrence, press Ctrl-Home followed by F3.
- Open the DSS file using
HecDss.open(...)(Slide 23 or Reading and Writing to HEC-DSS Files) - Set the time window using the
setTimeWindow(...)method (HecDss Secondary Methods) - Retrieve data using the
get(...)method (Slide 24 or HecDss Retrieval and Storage Methods) - Create a Plot object using
Plot.newPlot("GagePlot")(Slide 28 or Plotting Basics) - Add data to the plot using the
plot.addData(...)method (Slide 28 or G2dDialog Class)
Note that our Plot object is actually an instance of the Java G2dDialog class, so the terms are used interchangeably. - Save and test the script.Correct any problems until the script executes correctly.
- Use the console output (Advanced→Output→Console) to see what went wrong.
- Highlight all occurrences of "###" in the script.
Task 1 Script
from hec.script import HecDss, Plot
#
# setup
#
dssFilename    = "C:/Class/DSS/DSSVueScriptingWorkshop/ScriptingWorkshop.dss"
startTime      = "01JUN2009 0000"
endTime        = "31JUL2009 2400"
precipPathname = "//TULA/PRECIP//1HOUR/OBS/"
stagePathname  = "//TULA/STAGE//1HOUR/OBS/"
flowPathname   = "//TULA/FLOW-LOC CUM//1HOUR/OBS/"
#
# open the DSS file and read the data
#
dssFile = HecDss.open(dssFilename)
dssFile.setTimeWindow(startTime, endTime)
precipData = dssFile.get(precipPathname)
stageData  = dssFile.get(stagePathname)
flowData   = dssFile.get(flowPathname)
dssFile.done()
#
# display a plot of the data
#
plot = Plot.newPlot("GagePlot")
plot.addData(precipData)
plot.addData(stageData)
plot.addData(flowData)
plot.showPlot()
Question 1.1. What does the pink text represent in the text editor?
The pink text represents strings. Notice all the pink text starts and ends with quotes
Question 1.2. What does the green text represent in the text editor?
The green text represents comments. These lines will not be interpreted as code.
Question 1.3. How much precipitation fell during the 15:00, 16:00, and 17:00 hours of 12 Jun 2009?
0.01", 1.50", and 0.01', respectively
Question 1.4. How did you arrive at your answer?
By selecting File→ Tabulate from the plot menu and then subtracting subsequent values.
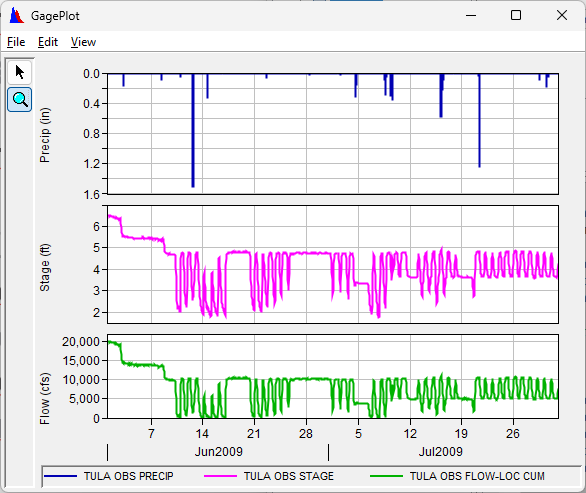
Task 2. Modify the Plot to Display the Precipitation as a Hanging Hyetograph
- Close all plots and tables from Task 1.
- If you have difficulty making the script from Task 1 work, edit your script to replace all of the text with the script code in the Task 1 Plot expansion box above.
- Save the current script as GagePlot2.
- Use the File→Save As menu item on the Script Editor.
Hint: GagePlot must first be open for editing. Enter the new name in the Save As dialog box.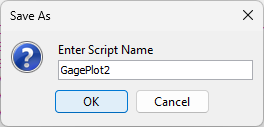
- Use the File→Save As menu item on the Script Editor.
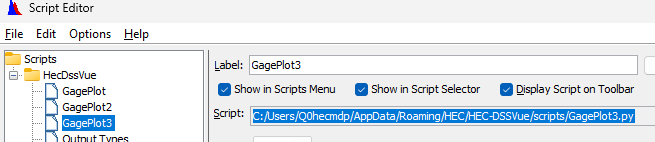
- Question 2.1. What is the file name of the new script (including the full path)?
C:\...\HEC\HEC-DSSVue\scripts\GagePlot2.py.
This is displayed in the “Script” field of the Script Editor.
- Convert Cumulative Precip to Incremental.
- Retrieve a TImeSeriesMath object instead of a TimeSeriesContainer object for precipitation (Slide 24 or the
read(...)method at HecDss Secondary Methods) - Apply the
successiveDifferences()method to the precipitation object. (Successive Difference for Time Series) - Convert the precipitation object back to a TimeSeiresContainer (Slide 25 or Get Data Container)
- Test the script to see that it now displays incremental precipitation instead of accumulated precipitation.
- Correct any problems until the script executes correctly.
- Retrieve a TImeSeriesMath object instead of a TimeSeriesContainer object for precipitation (Slide 24 or the
- Invert the precipitation Y axis.
Use Slide 31 or the Plotting Basics documentation as a guide to make the y axis increase downward for the precipitation.
Note: Be sure to place any new lines after theplot.showPlot()line.
- Retrieve the precipitation viewport into a variable.
- Use the Plot (G2dDialog) object's
getViewport(...)method with an integer argument.
- Use the Plot (G2dDialog) object's
- Retrieve the left axis of that viewport into a variable.
- Use the viewport object's
getAxis(...)method
- Use the viewport object's
- Set the axis to increase downward.
- Use the axis object's
setReversed(...)method.
- Use the axis object's
- Test the script to see that it now displays incremental precipitation increasing downward.
- Correct any problems until the script executes correctly
- Retrieve the precipitation viewport into a variable.
Task 2 Script
from hec.script import HecDss, Plot
#
# setup
#
dssFilename    = "C:/Class/DSS/DSSVueScriptingWorkshop/ScriptingWorkshop.dss"
startTime      = "01JUN2009 0000"
endTime        = "31JUL2009 2400"
precipPathname = "//TULA/PRECIP//1HOUR/OBS/"
stagePathname  = "//TULA/STAGE//1HOUR/OBS/"
flowPathname   = "//TULA/FLOW-LOC CUM//1HOUR/OBS/"
#
# open the DSS file and read the data
#
dssFile = HecDss.open(dssFilename)
dssFile.setTimeWindow(startTime, endTime)
precipData = dssFile.read(precipPathname)
precipData = precipData.successiveDifferences()
precipData = precipData.getData()
stageData  = dssFile.get(stagePathname)
flowData   = dssFile.get(flowPathname)
dssFile.done()
#
# display a plot of the data
#
plot = Plot.newPlot("GagePlot")
plot.addData(precipData)
plot.addData(stageData)
plot.addData(flowData)
plot.showPlot()
vp = plot.getViewport(0)
y1 = vp.getAxis("Y1")
y1.setReversed(False)
Question 2.2. What value did you use for the getViewport(...) method to get the desired veiwport
0
Question 2.3. What value did you use for the setReversed(...) method to get the desired effect?
False
Task 3. Customize the Plot Layout and Curve Colors
- Close all plots and tables from Task 2.
- If you have difficulty making the script from Task 2 work, edit your script to replace all of the text with the script code in the Task 2 Plot expansion box above.
- Save the current script to a new one named "GagePlot3"
- Use File→Save As as in Task 2.
- Use a custom plot layout.
- Create a new
PlotLayoutobject and assign it to a variable named "layout" (Slide 30 or PlotLayout Class).- Insert this code between the
plot.newPlot(...)line and theplot.addData(precipData)line.
- Insert this code between the
- Create a new
ViewportLayoutobject and assign it to a variable named "vpTop"- Insert this code immediately after the
newPlotLayout()line (Slide 30 or PlotLayout Class).
- Insert this code immediately after the
- Modify the
plot.addData(precipData)line to add to the left axis of vpTop instead (Slide 30 or ViewportLayout Class). - Create a new
ViewportLayoutobject and assign it to a variable named "vpBottom"- Insert this code immediately after the
vpTop.addCurve(precipData)line (Slide 30 or PlotLayout Class).
- Insert this code immediately after the
- Modify the
plot.addData(stageData)andplot.addData(flowData)lines to addstageDatato the left axis andflowDatato the right axis ofvpBottom(Slide 30 or ViewportLayout Class). - Configure the plot with the layout variable (Slide 30 or G2dDialog Class).
- Insert your code between the last
vpBottom.addCurve(...)line and theplot.showPlot()line.
- Insert your code between the last
- Test the script to see that it now displays incremental precipitation increasing downward.
- Correct any problems until the script executes correctly.
- Create a new
- Set the viewport heights so that the precip viewport is about half as tall as the stage/flow viewport (Slide 30 or PlotLayout Class)
- Test the script to see that it now displays incremental precipitation increasing downward.
- Correct any problems until the script executes correctly
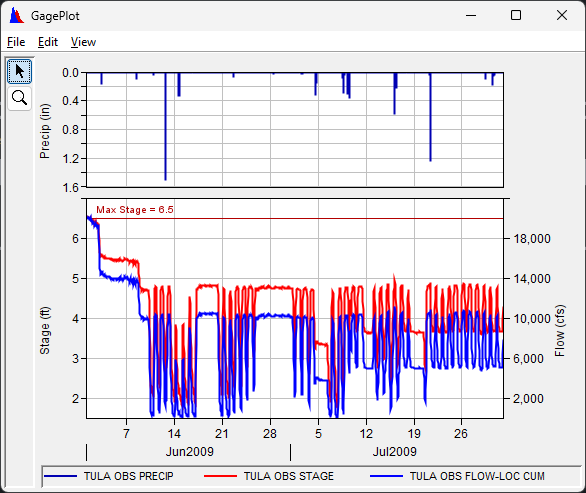
- Question 3.1. What weights gave you the desired look?
Various answers are correct. The following plot was generated with 1 and 3.
- Set the color of the stage to red and the flow to blue (Slide 31 or G2dDialog Class, G2dLine Class, and Colors).
- Test the script to see that it now displays incremental precipitation increasing downward.
- Correct any problems until the script executes correctly
- Question 3.2. What code did you insert to perform this?
plot.getCurve(stageData).setLineColor("red")plot.getCurve(flowData).setLineColor("blue") - Question 3.3. Where did you have to insert the code?
Anywhere after
plot.showPlot() - Execute scripts in various ways.
- Open the Script Selector by selecting Tools→Script Selector→Default from the HEC-DSSVue menu.
- Execute one or more of the scripts from the tool bar, Scripts menu, and Script Selector.
- Change the Display Controls (Slide 7)
- Edit one or more of the scripts, un-checking the Show in Scripts Menu, Show in Script Selector, and/or Display Script on Toolbar checkboxes before saving.
- Notice the effects on the scripts menu, Script Selector, and toolbar.
- Extra Credit. Execute one of the script from the command line.
1. Open the properties for the HEC-DSSVue application

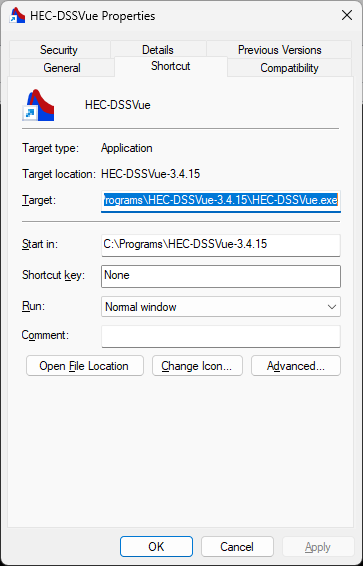
2. Copy the program location from the Target: field into a command line prompt

3. Backspace over "HEC-DSSVue.exe" and type "jython.bat"

4. Copy the script file name from the script editor Script: field
5. Paste the script file name onto the end of the command line

6. Press Enter
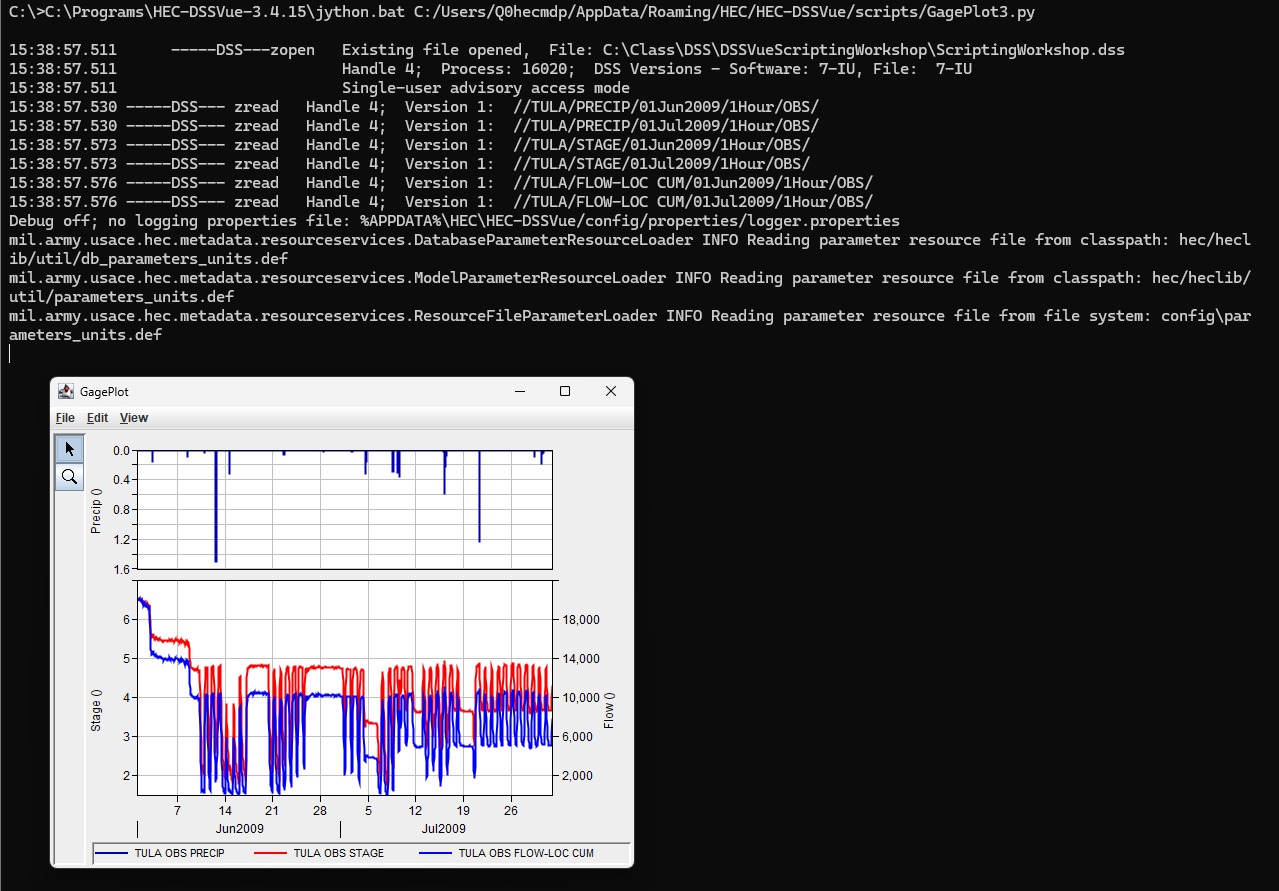
7. Close the plot to return to the command line.

Task 3 Script
from hec.script import HecDss, Plot
#
# setup
#
dssFilename    = "C:/Class/DSS/DSSVueScriptingWorkshop/ScriptingWorkshop.dss"
startTime      = "01JUN2009 0000"
endTime        = "31JUL2009 2400"
precipPathname = "//TULA/PRECIP//1HOUR/OBS/"
stagePathname  = "//TULA/STAGE//1HOUR/OBS/"
flowPathname   = "//TULA/FLOW-LOC CUM//1HOUR/OBS/"
#
# open the DSS file and read the data
#
dssFile = HecDss.open(dssFilename)
dssFile.setTimeWindow(startTime, endTime)
precipData = dssFile.read(precipPathname)
precipData = precipData.successiveDifferences()
precipData = precipData.getData()
stageData  = dssFile.get(stagePathname)
flowData   = dssFile.get(flowPathname)
dssFile.done()
#
# display a plot of the data
#
plot = Plot.newPlot("GagePlot")
layout = Plot.newPlotLayout()
vpTop = layout.addViewport(1)
vpTop.addCurve("Y1", precipData)
vpBottom = layout.addViewport(3)
vpBottom.addCurve("Y1", stageData)
vpBottom.addCurve("Y2", flowData)
plot.configurePlotLayout(layout)
plot.showPlot()
vp = plot.getViewport(0)
y1 = vp.getAxis("Y1")
y1.setReversed(False)
plot.getCurve(stageData).setLineColor("red")
plot.getCurve(flowData).setLineColor("blue")Question 3.4. How can you execute a script if Show in Scripts Menu, Show in Script Selector, and Display Script on Toolbar checkboxes are all unchecked?
- By using the Save and Test button on the Script Editor
- By executing it from the command line
Task 4. Add an Axis Marker for Maximum Stage
- Close all plots and tables from Task 3.
- If you have difficulty making the script from Task 3 work, edit your script to replace all of the text with the script code in the Task 3 Plot expansion box above.
- Save the current script to a new one named "GagePlot4"
- Import the AxisMarker module (Java class) from the hec.script package
- Note that the first line of our script already imports HecDss and Plot from this package
- Modify the line to add
", AxisMarker"to the end (without the quotes - don't forget the comma)- An alternative method is to insert a new line:
from hec.script import AxisMarker
- An alternative method is to insert a new line:
- Create an AxisMarker object and assign it to the variable "marker"
- Insert the code for this line at the end of the script (Slide 32 or AxisMarker Class)
- Set the marker properties (Slide 32 or AxisMarker Class)
- :axis = "Y1"
- value "6.5"
- labelText = "Max Stage = 6.5"
- lineColor = "darkred"
- labelColor = "darkred"
- Add the marker to the viewport that contains the data from the stageData object
- Question 4.1. How did you determine which viewport to add the AxisMarker to?
- You could use
plot.getViewport(stageData)to return the viewport. - You could see in the script (or in a displayed plot) that stageData was added to the 2nd created viewport in the PlotLayout object, so use
plot.getViewport(1)to return the viewport.- The only correspondence between the viewports in the PlotLayout object and in the Plot object is the order in which they're created.
- Therefore, we can't use the
vpToporvpBottomvariables after theplot.configurePlotLayout(layout)line
- You could use
- Test the script to see that it now displays the marker line at stage = 6.5
- Put the marker at the actual max stage.
- Note that the max stage ≈ 6.5, but it doesn't appear to be exactly 6.5.
- Search Math Functions to find how to get the maximum value from a TimeSeriesMath object.
- Question 4.2. What type of object is stageData in the script?
TimeSeriesContainer
- Question 4.3. How can you create a TimeSeriesMath object from it? (Slide 25)
TimeSeriesMath(stageData)
- Get the maximum stage value and assign it to variable
maxStage(Slide 25 and Maximum Value in a Time Series)- Don't forget to add the import statement from Slide 25.
- Insert the code immediately before the
marker = AxixMarker()line
- Convert the
maxStagevariable to a string.- Note that both the .value and .labelText AxisMarker properties are strings, so the floating point value will need to be converted.
- Use the Python str() function to get a string representation of
maxStageand assign it to variablemaxStageText
- Question 4.4. What code did you use to get the maximum stage and convert it to a string?
from hec.hecmath import TimeSeriesMathmaxStage = TimeSeriesMath(stageData).max()maxStageText = str(maxStage) - Modify the marker properties to use
maxStageTextinstead of "6.5". - Question 4.5. What code did you use to use maxStageText in the marker properties?
marker.value = maxStageStrmarker.labelText = "Max Stage = " + maxStageStr - Test the script to see how the marker is displayed.
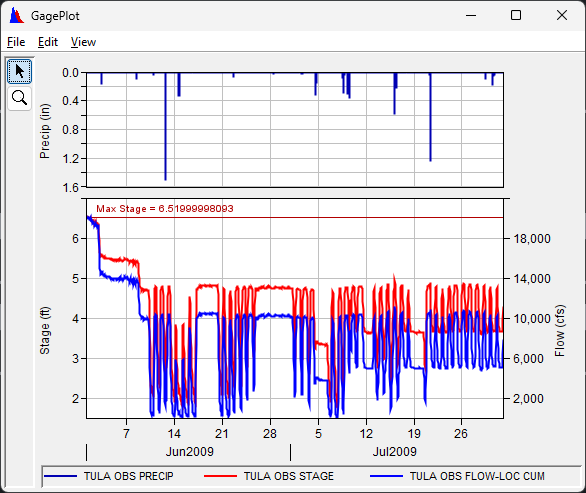
- Question 4.6. What is the text of the marker label
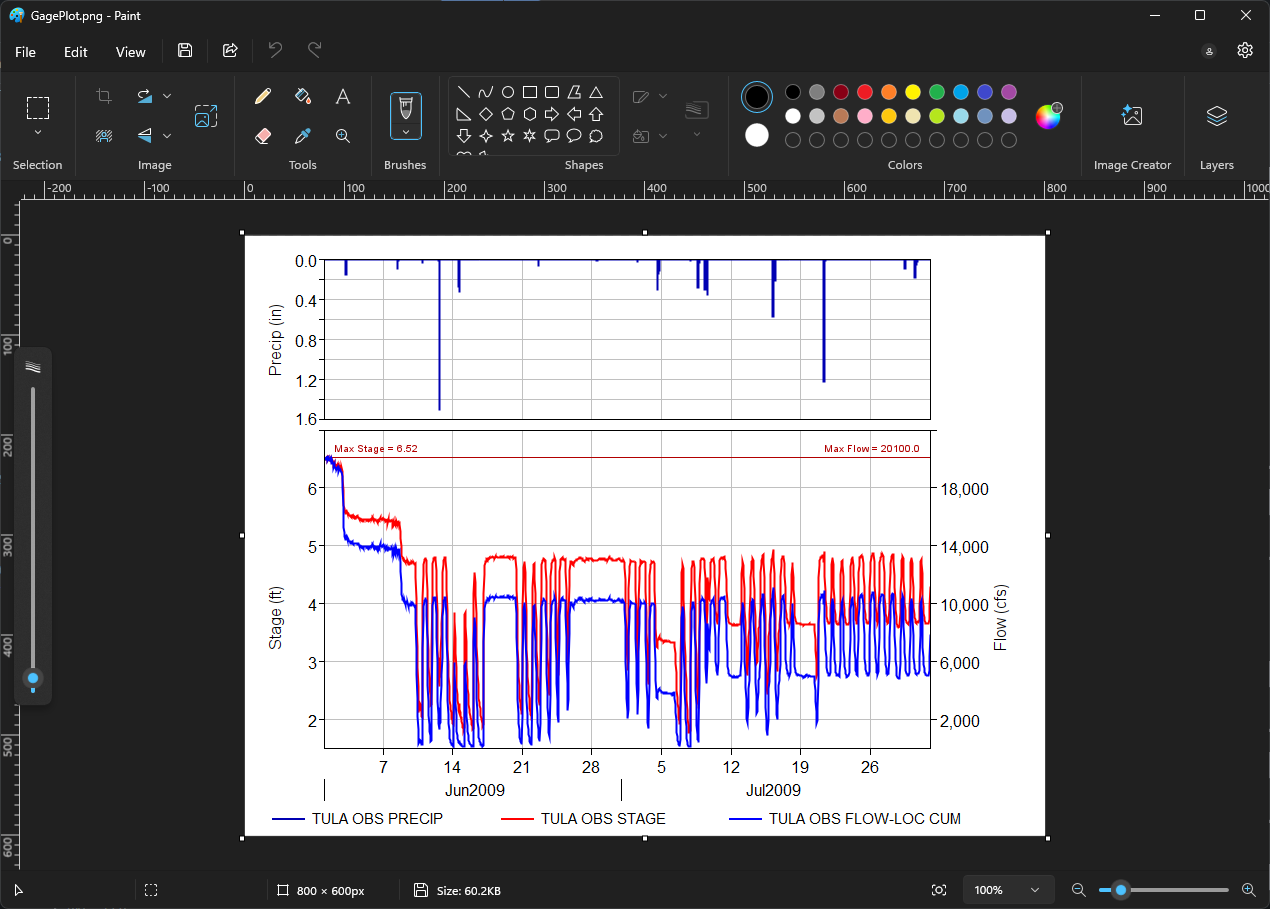
Max Stage = 6.5199999803
- Investigate the following options for outputting the maximum stage to the 1/100ths place:
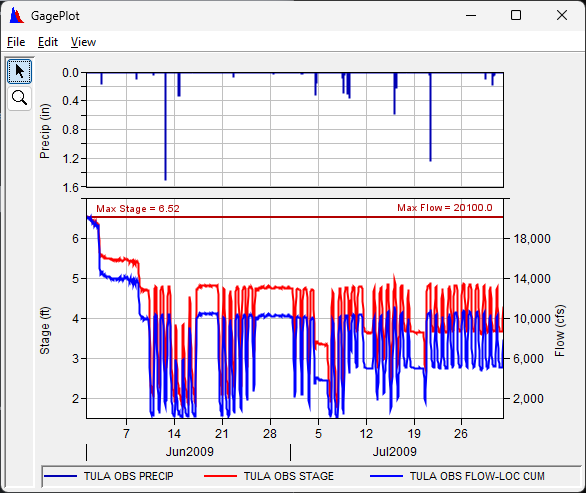
- Choose an option and implement it to show the maximum stage as "Max Stage = 6.52"
- Question 4.7. What method did you use?
Something like one of the following:
- Using
roundOff()maxStage = TimeSeriesMath(stageData).roundOff(6, -2).max()
maxStageText = str(maxStage) - Using
round()maxStage = round(TimeSeriesMath(stageData).max(), 2)
maxStageText = str(maxStage)maxStage = TimeSeriesMath(stageData).max()
maxStageText = str(round(maxStage, 2)) - Using
format()maxStage = TimeSeriesMath(stageData).max()maxStageText = "{:.2f}".format(maxStage)
- Using
- Question 4.8, Why would using
roundOff()not be the best choice here?Because it rounds every value in the time series, when we only need the output of the
max()method rounded.
- Extra Credit. Use the same method to create a dark red marker line at the maximum flow but align the label text to the right side.
Task 4 Script
from hec.script import HecDss, Plot, AxisMarker
from hec.hecmath import TimeSeriesMath
#
# setup
#
dssFilename    = "C:/Class/DSS/DSSVueScriptingWorkshop/ScriptingWorkshop.dss"
startTime      = "01JUN2009 0000"
endTime        = "31JUL2009 2400"
precipPathname = "//TULA/PRECIP//1HOUR/OBS/"
stagePathname  = "//TULA/STAGE//1HOUR/OBS/"
flowPathname   = "//TULA/FLOW-LOC CUM//1HOUR/OBS/"
#
# open the DSS file and read the data
#
dssFile = HecDss.open(dssFilename)
dssFile.setTimeWindow(startTime, endTime)
precipData = dssFile.read(precipPathname)
precipData = precipData.successiveDifferences()
precipData = precipData.getData()
stageData  = dssFile.get(stagePathname)
flowData   = dssFile.get(flowPathname)
dssFile.done()
#
# display a plot of the data
#
plot = Plot.newPlot("GagePlot")
layout = Plot.newPlotLayout()
vpTop = layout.addViewport(1)
vpTop.addCurve("Y1", precipData)
vpBottom = layout.addViewport(3)
vpBottom.addCurve("Y1", stageData)
vpBottom.addCurve("Y2", flowData)
plot.configurePlotLayout(layout)
plot.showPlot()
vp = plot.getViewport(0)
y1 = vp.getAxis("Y1")
y1.setReversed(False)
plot.getCurve(stageData).setLineColor("red")
plot.getCurve(flowData).setLineColor("blue")
maxStage = TimeSeriesMath(stageData).max()
maxStageText = str(round(maxStage, 2))
marker = AxisMarker()
marker.axis = "Y1"
marker.value = maxStageText
marker.labelText = "Max Stage = " + maxStageText
marker.lineColor = "darkred"
marker.labelColor = "darkred"
plot.getViewport(stageData).addAxisMarker(marker)
maxFlow = TimeSeriesMath(flowData).max()
maxFlowText = str(round(maxFlow, -1))
marker = AxisMarker()
marker.axis = "Y2"
marker.value = maxFlowText
marker.labelText = "Max Flow = " + maxFlowText
marker.lineColor = "darkred"
marker.labelColor = "darkred"
marker.labelAlignment = "right"
plot.getViewport(flowData).addAxisMarker(marker)Task 5. Save Plot to Image File
- Close all plots and tables from Task 4.
- If you have difficulty making the script from Task 4 work, edit your script to replace all of the text with the script code in the Task 4 Plot expansion box above.
- Create a variable named
plotFilenamethat is the same asdssFilename, but with "ScriptingWorkshop.dss" replaced with "GagePlot.png"- Use the Python String replace() Method or Python OS.Path Methods to create the new variable
- Question 5.1. How did you create the variable?
Should be something like one of the following:
- Using string replace() method
plotFilename = dssFilename.replace("ScriptingWorkshop.dss", "GagePlot.py")
- Using os.path methods
import os.pathplotFilename = os.path.join(os.path.dirname(dssFilename), "GagePlot.py")
- Using string replace() method
- Save the plot to the plot file.
- Find the method to use in G2dDialog Class and implement it at the end of your script.
- Close the plot from the script after you have saved it to the plot file (G2dDialog Class)
- Test the script.
- Note that the plot does not stay open as it did previously.
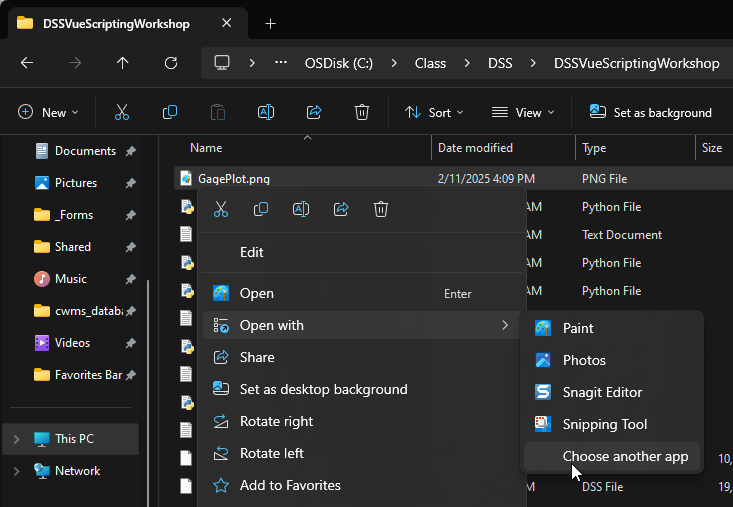
- Open the GagePlot.png file in the workshop directory.
- Find the file in the workshop directory.
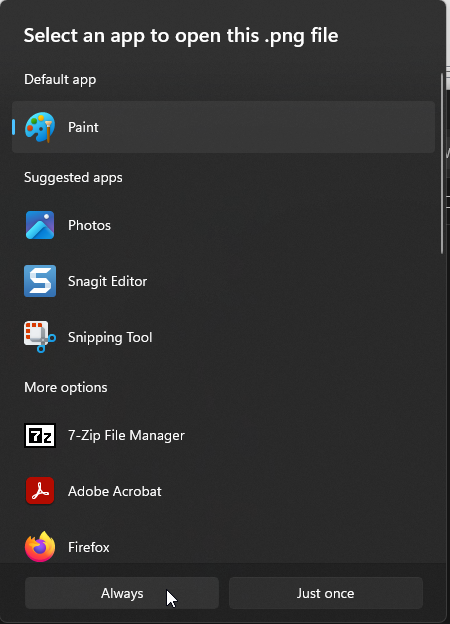
- Right click on the file and select Open with→Choose another app
- Select Paint and click the Always button.
- Close the image.
- Make the script open the plot file.
- insert the line
import subprocessnear the top of the script. - insert the line
subprocess.call(plotFilename, shell=True)at the end of the script.
- insert the line
- Test the script to make sure it opens the plot file in Paint.
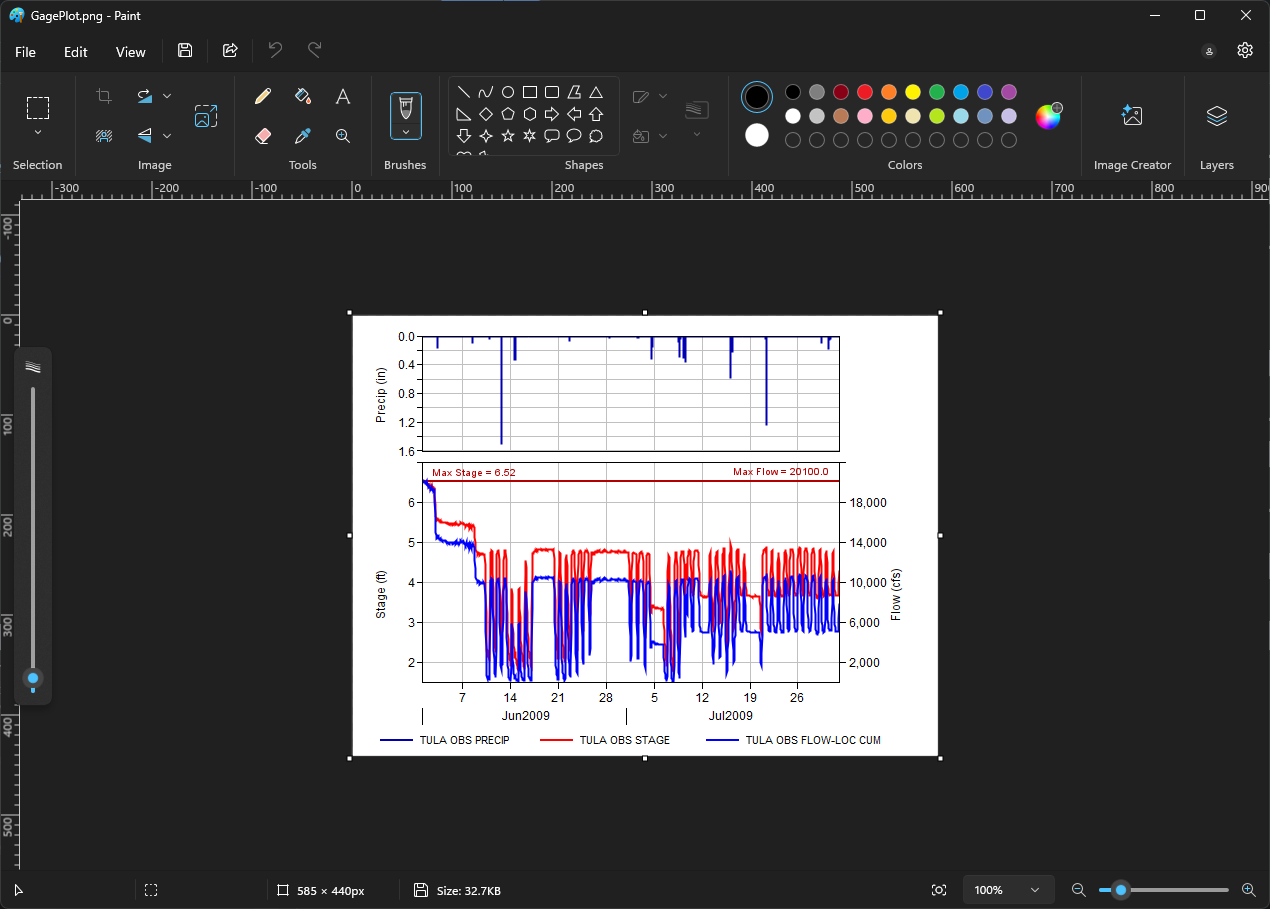
- Question 5.2. What is the size of the plot file in pixels?
585 x 440
- Close Paint.
- Set the size of the image to 800 x 600.
- Insert the line
plot.setSize(800, 600)immediately before the plot.saveToPng(plotFilename) line. - Test the script.
- Question 5.3. What is the image size now?
785 x 540
- Question 5.4. Why is it not 800 x 600?
Because the image in the file doesn't have all of the "decorations" of the on-screen plot (title, menu bar, toolbars, etc...)
- Adjust the width and height in the
setSize()method until the image is 800 x 600. - Question 5.5. What width and height did you specify to generate an 800 x 600 pixel image?
815 x 660
- Insert the line
Task 5 Script
from hec.script import HecDss, Plot, AxisMarker
from hec.hecmath import TimeSeriesMath
import os
import subprocess
#
# setup
#
dssFilename    = "C:/Class/DSS/DSSVueScriptingWorkshop/ScriptingWorkshop.dss"
startTime      = "01JUN2009 0000"
endTime        = "31JUL2009 2400"
precipPathname = "//TULA/PRECIP//1HOUR/OBS/"
stagePathname  = "//TULA/STAGE//1HOUR/OBS/"
flowPathname   = "//TULA/FLOW-LOC CUM//1HOUR/OBS/"
#
# open the DSS file and read the data
#
dssFile = HecDss.open(dssFilename)
dssFile.setTimeWindow(startTime, endTime)
precipData = dssFile.read(precipPathname)
precipData = precipData.successiveDifferences()
precipData = precipData.getData()
stageData  = dssFile.get(stagePathname)
flowData   = dssFile.get(flowPathname)
dssFile.done()
#
# display a plot of the data
#
plot = Plot.newPlot("GagePlot")
layout = Plot.newPlotLayout()
vpTop = layout.addViewport(1)
vpTop.addCurve("Y1", precipData)
vpBottom = layout.addViewport(3)
vpBottom.addCurve("Y1", stageData)
vpBottom.addCurve("Y2", flowData)
plot.configurePlotLayout(layout)
plot.showPlot()
vp = plot.getViewport(0)
y1 = vp.getAxis("Y1")
y1.setReversed(False)
plot.getCurve(stageData).setLineColor("red")
plot.getCurve(flowData).setLineColor("blue")
maxStage = TimeSeriesMath(stageData).max()
maxStageText = str(round(maxStage, 2))
marker = AxisMarker()
marker.axis = "Y1"
marker.value = maxStageText
marker.labelText = "Max Stage = " + maxStageText
marker.lineColor = "darkred"
marker.labelColor = "darkred"
plot.getViewport(stageData).addAxisMarker(marker)
maxFlow = TimeSeriesMath(flowData).max()
maxFlowText = str(round(maxFlow, -1))
marker = AxisMarker()
marker.axis = "Y2"
marker.value = maxFlowText
marker.labelText = "Max Flow = " + maxFlowText
marker.lineColor = "darkred"
marker.labelColor = "darkred"
marker.labelAlignment = "right"
plot.getViewport(flowData).addAxisMarker(marker)
plotFilename = os.path.join(os.path.dirname(dssFilename), "GagePlot.png")
plot.setSize(815, 660)
plot.saveToPng(plotFilename)
plot.close()
subprocess.call(plotFilename, shell=True)