Download PDF
Download page Background for Flood Warning System Planning Studies.
Background for Flood Warning System Planning Studies
Overview of Flood Warning Systems
What is it? A Flood Warning System (FWS) is an integrated package of data collection and transmission equipment, forecasting models, response plans and procedures, and human resources. Together these increase flood warning (lead) time. With increased lead time, public officials and citizens can take actions to reduce damage and to protect lives. A FWS is classified as a nonstructural damage reduction alternative: it will not reduce flood flows or flood stages, but it will reduce damage incurred due to a specified stage. A complete flood warning system includes components that are illustrated conceptually below.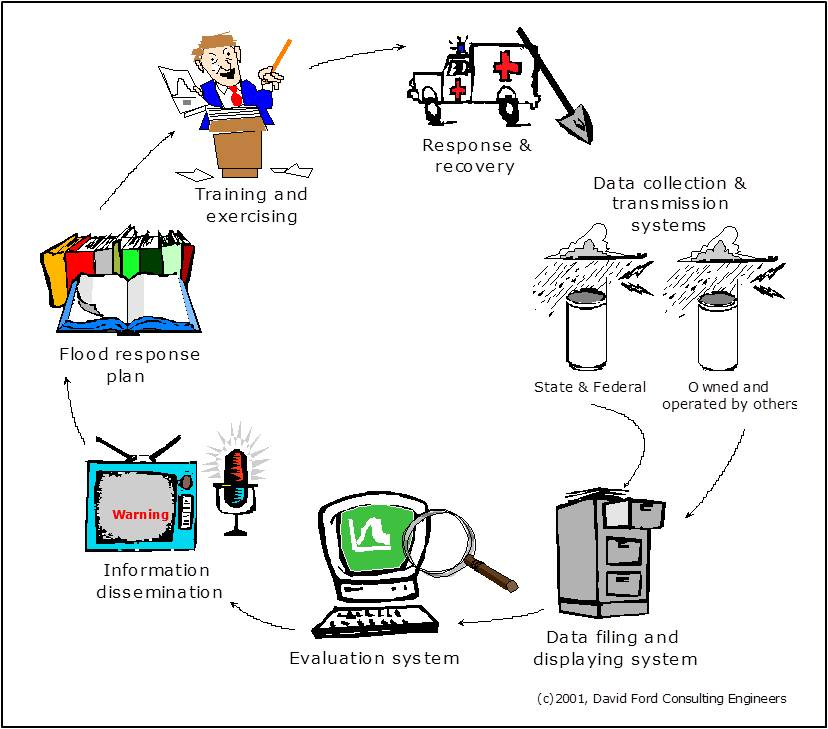
Flood warning begins with data collection and transmission. The instruments in the data collection and transmission system measure current rainfall depths, water levels, and other indices of watershed conditions. Rainfall commonly is measured in a FWS with a tipping-bucket rain gage. Such a gage records the clock time at which a small bucket of known volume within the gage fills and tips. From this time series, the rate of and cumulative depth of rainfall can be calculated. Water-level observations provide the stage information needed for comparison with established flood-threat thresholds.
The environmental condition measurements form the basis of flood-threat recognition. In the simplest case, the observed water level can be compared with a predetermined threshold. This threshold may be the elevation at which water will flow out of bank and damage property or threaten lives. If the level reaches the threshold, then a warning is issued.
The comparison of observations to thresholds may occur at the observation site or at a central flood warning center. Data transmission must support the update interval and reliability needed for threat recognition. The National Hydrologic Warning Council's ALERT2 Technical Working Group (NHWC, n.d.) provides protocol resources and historical ALERT documentation. Evaluate telemetry coverage, data latency, quality control, and outages as part of the complete system, rather than assuming that a reporting protocol alone establishes usable warning time.
The data transmitted from the sensors are received, decoded, managed, and analyzed at a central site. This site is equipped with a base station that includes an antenna and cabling; a modem, radio, or satellite receiver; a decoder - a microprocessor that converts the signal from the gages into digital data appropriate for filing or analyzing with a computer; and a dedicated computer with add-ons and peripheral devices.
The rainfall and streamflow data are managed at the flood warning center with base station software: database-management software that translates and stores data for subsequent analysis and reporting and visualization software that expedites examination of the data for threat detection. Commercial, off-the-shelf base station software systems are available. If the data are needed at more than a single site to ensure proper response, a data dissemination system redistributes the observations from the central site to other sites, using, for example, a local area network or a web site.
The evaluation system includes tools to display and inspect the incoming data to determine if a flood threat exists and tools to forecast occurrence of a future threat. For example, an evaluation system might be configured to compare observed water levels at the gage on Updah Creek to the level at which water is known to overflow and inundate structures nearby on Penny Lane. If the level reaches that threshold, then a warning is issued and appropriate actions are taken.
The evaluation system, at a minimum, includes (1) stage or rainfall depth thresholds that will be used to identify flood threats, and (2) the method by which the threat recognition plan is implemented. Alternatives for this threat recognition include (1) an operator-monitored procedure in which a human operator inspects the incoming data, compares the values with the thresholds identified in the threat recognition plan, and takes appropriate action, or (2) an automated procedure, in which software automates examination and comparison of the incoming data to rules of the threat recognition plan. If a threat exists, or is expected, an information dissemination system communicates an appropriate warning, first to emergency responders, and then to the public.
In many cases, threat recognition based upon observations alone will not provide adequate time to respond appropriately. In those cases, a forecasting system may extend the lead time by using mathematical models of watershed and channel behavior, along with the rainfall and water level observations, to predict future response of the watershed and channel. Alternatives to mathematical models for forecasting include (1) empirical forecasting models, which predict future stages based upon patterns inferred statistically from analysis of historical stages, historical rainfall depths, or both, and (2) conceptual models, which use a mathematical representation of underlying physical properties to forecast future stages, given observations of historical stage, historical rainfall, or both.
When a threat is recognized, either through observation or prediction, and warnings are issued, actions begin in earnest to protect lives and property. For efficiency, these actions should follow procedures spelled out in a flood response plan.
Authority and Procedural Guidance
USACE activities in flood warning are authorized by:
- The Flood Control Act of 1936.
- Section 206 of the Flood Control Act of 1960.
- Executive Order 11988.
- Section 73 of Public Law 93-251.
The following USACE guidance is particularly relevant to flood warning system planning and design:
- ER 1105-2-103 (USACE, 2023) provides the current overall planning framework and supersedes Chapters 1 through 3 of the 22 April 2000 ER 1105-2-100. Use the applicable planning requirements when defining the study and evaluating alternatives.
- ER 1105-2-101 (USACE, 2019, with 2022 errata) establishes risk-assessment requirements for flood risk management studies, including uncertainty, life safety, and communication of residual risk.
- EM 1110-2-1417 (USACE, 1994), Chapters 10 and 17, addresses model calibration and frequency-based runoff analysis. Check the model's ability to reproduce timing as well as peak flow when using it to estimate threshold-exceedance times.
- EM 1110-2-1619 (USACE, 2025), paragraph 2-3 and Chapter 11, addresses expected annual consequences and life-loss evaluation. Figure 11-1 and Table 11-1 distinguish hazard identification, communication, warning issuance, public response, and evacuation.
- ECB 2026-1 (USACE, 2026), paragraphs 4c, 4d, and section 8, applies to planning analyses that rely on stationarity-based frequency relationships. Its paragraph 4f exception covers specified short-term water-management activities; the bulletin expires 9 January 2028.
- For studies involving USACE-operated or -maintained dams or levee systems, ER 1110-2-8165 (USACE, 2024), paragraphs 8 and 12, and EP 1110-2-19 (USACE, 2025), paragraph 12, address inundation information, emergency action plans, notifications, and coordination. Their applicability is specific to those programs; they are not a blanket requirement for every local urban FWS.
ETL 1110-2-540 (USACE, 1996) is retained as the historical source for this chapter's warning-time framework and Day Curve. Its 30 September 1996 text was located in an online reproduction, but its current administrative status and any direct successor have not been confirmed. It is not presented here as current procedural authority.
Study Objectives
Hydrologic engineering studies play a critical role in providing information for planning, designing, implementing, and operating a flood warning system. Studies are required to:
- Identify vulnerable areas for which flood warning is an effective flood damage reduction alternative.
- Establish rainfall and water-level thresholds for threat recognition.
- Link the thresholds to the vulnerability assessment, so that those who should be notified can be identified.
- Identify locations for rainfall and water-level sensors.
- Develop and provide the tools for forecasting.

The economic discussion below explains the framework used in the historical Case Study (IWR, 1994). A current study should establish its evaluation scope under ER 1105-2-103 (USACE, 2023); potential life loss is assessed separately from economic considerations under EM 1110-2-1619 (USACE, 2025), paragraph 11-1b.
For every FWS in which the USACE plays a role, the first step is to assess the benefit of the FWS, so that the federal interest in implementation can be determined. For this federal interest to exist, the system's benefit must exceed its cost. The benefit of a flood warning system is due to actions taken or actions deferred as a result of the warnings issued. The benefit can be categorized as either tangible benefit, which can be assigned a monetary value, or intangible benefit, which cannot be assigned a monetary value but may be otherwise quantified or described (IWR, 1994). The FWS benefit may be categorized further as direct or indirect. Direct benefit accrues to floodplain occupants who are "protected" by the system. This benefit includes inundation-reduction benefit and emergency response and recovery cost avoided. Conversely, indirect benefits result from externalities: impacts outside the floodplain or impacts secondary to the response system's design goals. Assessment of the direct tangible benefit is the subject of this chapter.
Study Procedures
The historical Case Study uses the Day Curve from ETL 1110-2-540 (USACE, 1996), Figure 4-4, shown below. The ETL describes this generic curve as a reasonableness check on estimated flood-loss reduction and recommends developing a site-specific curve where possible; it is not a universal benefit function.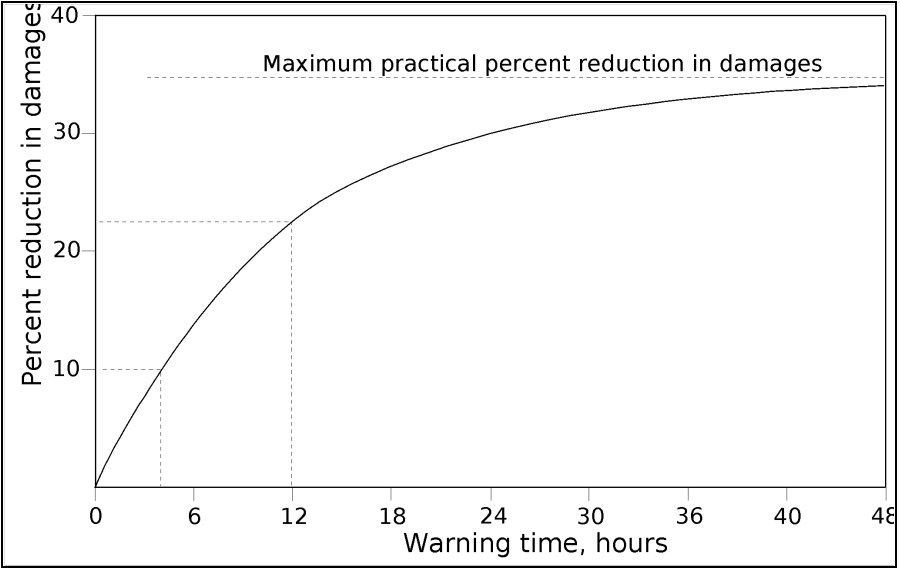
The Day Curve was developed from empirical analysis of property in a floodplain, considering the value and spatial distribution of property and the likely response of property owners when warned. The Day Curve estimates damage reduction (as a percentage of total inundation damage) as a function of the warning (mitigation) time - the time available for citizens and emergency responders to protect lives and property. For example, the curve shows that if the warning time is zero hours, a FWS provides no direct tangible benefit. If the warning time is twelve hours, the curve predicts that the damage will decrease by 23 percent. The curve also suggests that no matter how great the warning time, the maximum possible reduction is about 35 percent of the total damage due to the flood. This is logical, as some property, including most structures, simply cannot be moved.
In the historical procedure, the analyst estimates the mitigation time attributable to the FWS using the warning-time framework described in ETL 1110-2-540 (USACE, 1996). This framework starts with a maximum potential warning time; this is the time that passes between the first detectable or predictable precipitation and the time at which the stage exceeds the threshold for damage or threat to life at a critical location. The actual warning time, better known as mitigation time, is the maximum potential warning time less (1) the time required actually to detect and recognize the threat, (2) the time required to notify emergency responders and for those responder to make decisions about actions, and (3) the time required to notify the public. For example, if the maximum potential warning time is ten hours, and if six hours are required for detection, one hour required for emergency responder notification and decision making, and one hour required for public notification, then the actual mitigation time is only two hours. If the FWS reduces the detection time to four hours, the mitigation time increases to four hours.
The detection and notification times depend upon the design of the FWS, the equipment included, the efficiency of the response plans, and so on. The maximum potential warning time, on the other hand, depends on the characteristics of the watershed and storms that occur. A watershed model such as HEC-HMS will provide the information to estimate that. The case study that follows illustrates this.

Current guidance.
Current life-safety analysis distinguishes the delays between hazard identification, agency notification, warning issuance, public receipt, protective-action initiation, and reaching safety (EM 1110-2-1619 (USACE, 2025), paragraph 11-3a(2), Figure 11-1, and Table 11-1). HEC-HMS provides hydrologic timing inputs to this assessment; the property-damage Day Curve does not estimate evacuation completion or life loss.
Planning workflow using HEC-HMS
- Define the vulnerable locations, relevant flow or stage thresholds, and the hydraulic information supporting each threshold with the responsible warning and emergency-management partners.
- Specify the without-project and with-project monitoring, forecast, notification, and response arrangements. Document what observations and forecasts would actually be available at each forecast issue time.
- Develop and check the HEC-HMS model and precipitation inputs. Evaluate timing, initial watershed state, storm duration and pattern, rainfall/runoff frequency assumptions, and uncertainty.
- Replay storms at successive issue times using only the data available at those times. Include data transmission, quality control, model computation, and decision delays in the system assessment.
- Extract threshold-exceedance and recognition times at each vulnerable location. Keep notification, public response, and evacuation delays explicit instead of treating all hydrologic lead time as time available for action.
- Test alternative storm, watershed-state, telemetry, and forecast scenarios. Report short lead times, missed detections, and false alarms where the study data support those measures.
- Provide event-specific timing and uncertainty to the consequence and economic analyses. Distinguish conditional warning-time statistics from expected annual consequences and evaluate life-safety effects separately.
Current HEC-HMS tools support different parts of this workflow. Use Time-Series Data and Specified Hyetograph inputs for controlled retrospective tests, and Forecast Alternatives to separate a look-back period from a forecast period. Scripting can repeat computations, while Ensemble Analysis can organize alternative precipitation and watershed scenarios; the flood-forecasting ensemble tutorial illustrates that use.
For gaged applications, forecast parameter editors, including the Combined Parameter Editor, and forecast optimization workflows can support forecast preparation when suitable observations are available. Preserve the data cutoff when replaying past forecasts; parameter fitting using later observations would give the test information the operator did not have. See Flood Forecasting Applications for that operational workflow.