Download PDF
Download page Estimating Time of Concentration & Storage Coefficient.
Estimating Time of Concentration & Storage Coefficient
Last Modified: 2025-01-29 17:09:33.485
This tutorial demonstrates how to estimate Clark's storage coefficient (R) for three subbasins.
Software Version
HEC-HMS version 4.13 beta 4 was used to create this example. You can open the example project with HEC-HMS 4.13 or a newer version. Downloads are available here: https://www.hec.usace.army.mil/software/hec-hms/downloads.aspx
Overview
In this tutorial, you will be estimating the Tc and R. We will be using an equation that was developed for a Dam Safety Study in Pennsylvania.
| T_c = 2.2 * (\frac{L*L_C}{\sqrt{Slope_{10-85}}})^{0.3} |
where T_c = time of concentration (hrs); L =longest flow path (mi); L_c = Centroidal flow path (mi); Slope_{10-85} = average slope of the flow path represented by 10 to 85 percent of the longest flow path (ft/mi).
Once the time of concentration is estimated, the storage coefficient will be estimated using the following relationship from nearby watersheds:
| \frac{R}{T_c+R}= 0.65\;or\;R=\frac{13}{7}*T_c |
Extract Basin Characteristics
- To estimate the land slope, open the Punx.hms project.
- Select the Sep2018 Basin Model.

- Compute the basin characteristics by selecting Parameters | Characteristics | Subbasin.

HEC-HMS will auto-populate basin characteristics for each subbasin.


The 10-85 Flowpath Slope in the regression equation is in ft/mi, make sure you select the correct statistic and apply the appropriate factor when estimating the time of concentration.
- Select the Sep2018 Basin Model.
- Extract the Longest Flowpath Length, Centroidal Flowpath Length, and the 10-85 Flowpath Slope for Stump Creek, Mahoning Creek, and EB Mahoning Creek.
Time of Concentration and Storage Coefficient Computation
- Using the equation and subbasin characteristics above, calculate the time of concentration for each subbasin. Note the values for each subbasin.
2.2 * (pow(([Longest Flowpath Length (MI)] * [Centroidal Flowpath Length (MI)]) / (pow([10-85 Flowpath Slope (FT/MI)],0.5)),0.3))CODE
After computing your time of concentration, begin computing your storage coefficient value. Note the values for each subbasin. - Once you have your Tc and R values computed for each subbasin, insert your computed values into the HEC-HMS model.
Global Editor Expression Calculator
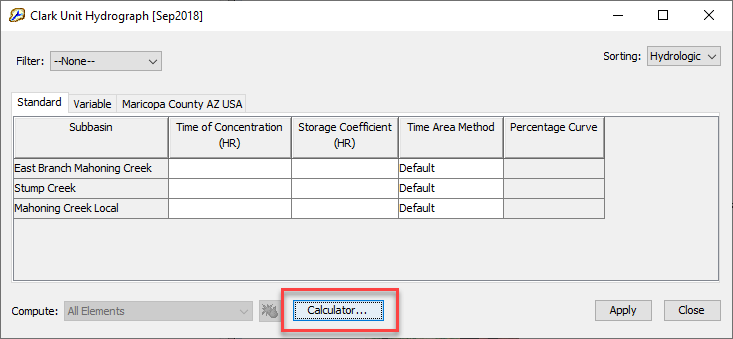
Note: The below steps demonstrate how to manually calculate and populate Tc and R parameters element by element within the Transform Component Editor. An alternate approach, which is recommended for large models, is to use the expression calculator within the Transform Global Editor (as seen below).

- Select subbasin element East Branch Mahoning Creek. The Component Editor will appear for East Branch Mahoning Creek below.
In the Component Editor, select the Transform tab and enter your Tc and R values for East Branch Mahoning Creek. Leave the Method as "Standard" and the Time-Area Method as "Default".

Using the HEC-HMS Technical Reference Manual, can you find the default time-area relationship built into HMS?The time-area relationship can be found here: Clark Unit Hydrograph Model under Estimating Model Parameters.
- Repeat the above two steps for the remaining two subbasins.
- Select subbasin element East Branch Mahoning Creek. The Component Editor will appear for East Branch Mahoning Creek below.
- Once you have your parameters entered, compute the simulation by selecting the Sep2018 simulation on the toolbar and click on the compute button.
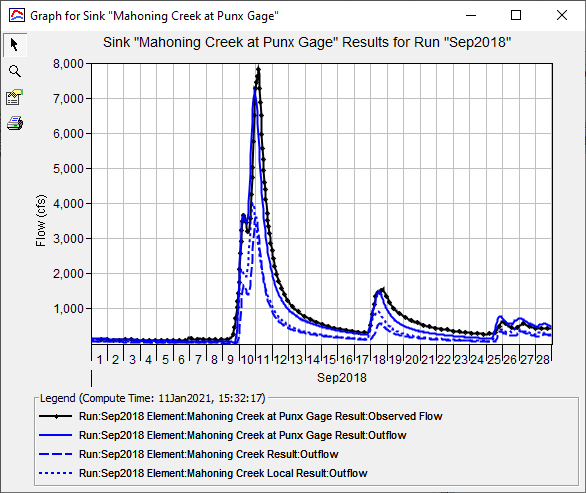
- Once the compute is complete, close the compute progress bar and navigate to the Results tabs. Under the Simulation Runs folder, review your results by expanding the Sep2018 simulation and clicking through your model elements. When you are done reviewing your results, click on the Mahoning Creek at Punx Gage element and select Graph. The following graph should appear showing the combined simulated flow (blue lines) compared with the observed flow (black dotted lines)
- BONUS - re-compute the Time of Concentration and Storage Coefficient using the Expression Calculator. Try using the Expression Calculator in the Clark Unit Hydrograph Global Editor to compute Tc and R described here.
Questions
What values did you find for your Tc and R?
Using the regression equation and basin characteristics from HMS:
Subbasin Tc R East Branch Mahoning Creek 4.72 8.77 Stump Creek 5.86 10.88 Mahoning Creek Local 7.02 13.04 Is the hydrograph output from your simulation a "unit hydrograph"? Why or why not? If not, how would you go about generating a unit hydrograph in HEC-HMS?
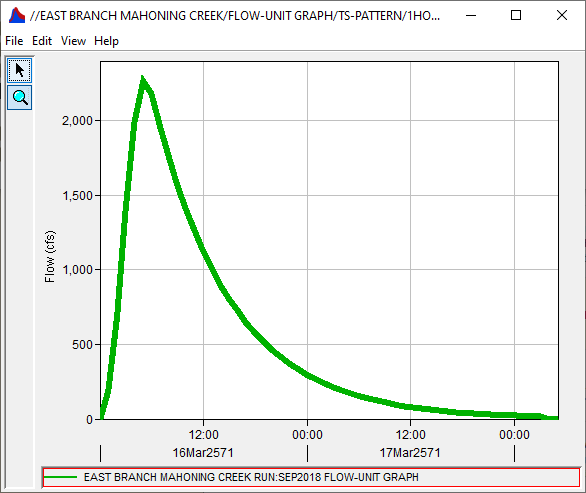
No, the definitions of a unit hydrograph is one unit of uniform excess precipitation over the watershed. The hydrograph output is the composition of multiple, temporally varying, scaled unit hydrographs where the precipitation was either larger or smaller than 1 unit. The output hydrograph also includes baseflow which is accounting for more than just excess runoff. You can generate a unit hydrograph from your Clark method by turning off any losses (setting losses to zero), removing the baseflow component, inputting one inch of precipitation in the meteorological model over the entire basin, and simulating the model. Additionally, the DSS output also stores the unit hydrograph!
How does your simulated results compare to the observed hydrograph?
The simulated hydrograph matches pretty closely to the observed hydrograph! This is likely because other model parameters have been calibrated for you.
Continue to Time of Concentration and Storage Coefficient Impacts to the Hydrograph