Download PDF
Download page Creating Paired Data.
Creating Paired Data
In this tutorial, you will create a Paired Data object that represents a river rating curve used for estimating stages given river discharges.
Software Version
HEC-HMS version 4.13 beta 4 was used to create this example. You can open the example project with HEC-HMS 4.13 beta 4 or a newer version.
This tutorial can be completed independently, beginning with a fresh version of the HEC-HMS project available on the Shared Component Data Overview page, or continuing from the Creating Time Series Data tutorial.
Project Files
Download initial project files provided on the Shared Component Data Overview page
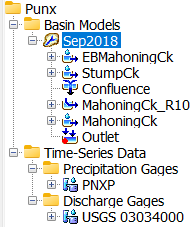
Step 1. Begin by opening the project in HEC-HMS 4.13 Beta 2 or later. You will see that this project has a basin model already created for you. If you are continuing on from the Time Series Data tutorial, you will also see time series data in your project, as below:
Creating an Elevation-Discharge Curve with Manual Entry
Many types of paired data can be used to represent functions within HEC-HMS. In this example, an elevation-discharge function (also referred to as stage-discharge function in HEC-HMS) will be used to represent a rating curve so that stages can be calculated from computed discharges.
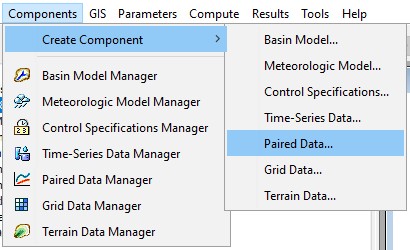
Step 2. Create a new paired data function by going into the Components menu in the menu bar, and selecting Create Component and then Paired Data.
Components | Create Component | Paired Data
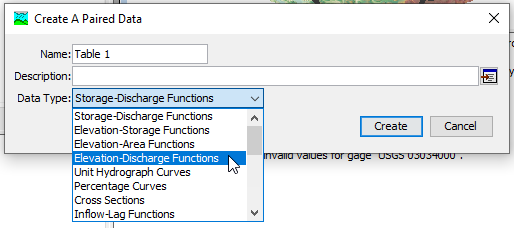
Step 3. A new window will appear prompting you to give a name and description to a new paired data curve. But first, select Elevation-Discharge Functions for the data type.
Step 4. The data you will be given in order to define this function has been interpolated from field observations using LOESS (Locally Weighted Scatterplot Smoothing) on the log-transformed stages and flows. Name the paired data Interpolated Rating Curve. Descriptions are optional but good practice, so give this paired data curve a reasonable description(e.g. LOESS interpolated log-log field measurements). After populating the information, click Create.

Step 5. After clicking Create, you should notice a new folder in the tree view of the Watershed Explorer for Paired Data. Expand this folder, and you should see a sub-folder labeled Elevation-Discharge Functions. HEC-HMS organizes each data type into its own distinct folder. Expand this folder, and you should see the rating curve you just created. Click on it to select it and open its properties in the Component Editor.
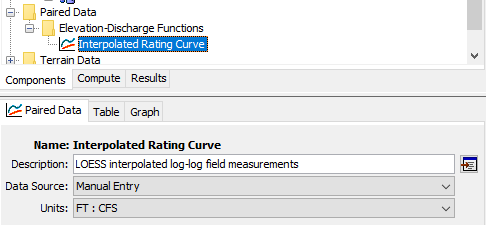
Step 6. The default settings for the data source is acceptable. Make sure the units label is set to FT : CFS. Click on the Table tab to see the manual data entry view.

You have been provided a comma-separated value file containing the interpolated rating curve called mahoning_rating.csv in the data folder inside the HEC-HMS project:

Step 7. Right-click on this file and select Open with | Excel.
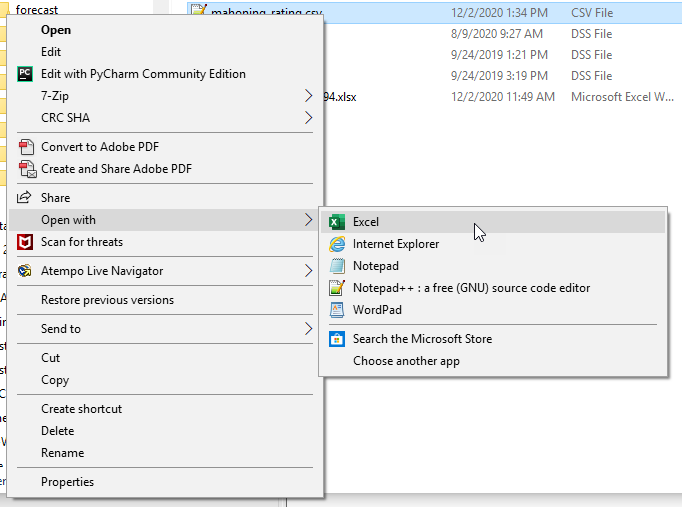
In Excel you will see two columns, one for stage and one for discharge.
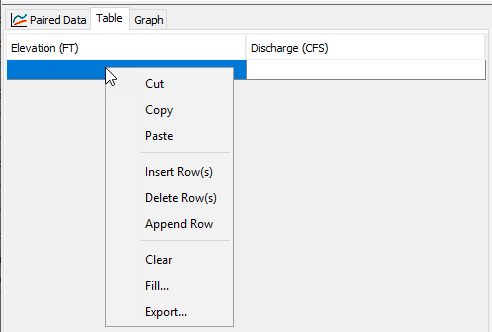
Step 8. Select the entire column of stage values and copy it. Then, return to HEC-HMS. Click in the first cell of the Elevation (FT) column of the table view. Then, right-click and select Paste.
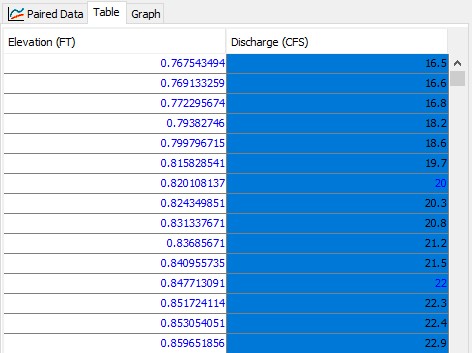
Step 9. You should see several hundred values fill in. Repeat this procedure for the discharge values by switching back to Excel, copying the column of discharge values, clicking in the first cell of the Discharge (CFS) column of the table view, right-clicking, and pasting. After pasting the discharge values, the first few rows should look like this:
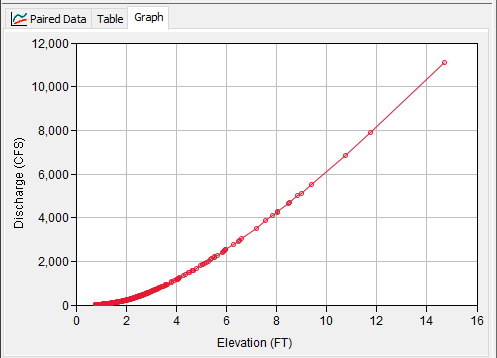
Step 10. Save your project by clicking the Save icon in the toolbar, or by pressing Ctrl+S. Then, from the Component Editor, switch from the table view to the graph view by clicking on the Graph tab. You should see a graph like below:
Step 11. Finally, you can verify that this curve is available for estimating stage/elevation by opening the basin model. Select the Sep2018 basin model, and click on the Outlet element in the tree.
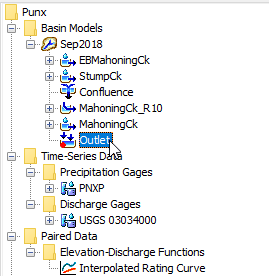
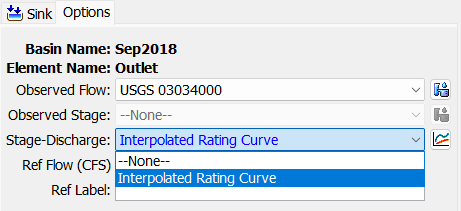
Step 12. In the Component Editor, switch to the Options tab. You will see that the menu item for Stage-Discharge is expandable, and that you can select the Interpolated Rating Curve paired data. Only elevation-discharge paired data curves are able to be selected in this menu. If you do not see the interpolated rating curve, then verify that it was created as an elevation-discharge function.
What potential limitation does using only field observations for a rating curve create in a hydrologic simulation? What does HEC-HMS not do with data in a paired data curve?
Field observations only span the range of observed flows. If HEC-HMS simulates a flow larger than observation, it will not be able to use the paired data to estimate the stage associated with that flow. HEC-HMS does not extrapolate paired data curves. If you want to ensure that the paired data curve covers the entire range of simulation, you will need to credibly extrapolate it yourself.
Project Files
Final project files provided on the Shared Component Data Overview page
Continue to Creating Grid Data