Download PDF
Download page Shared Component Data Overview.
Shared Component Data Overview
Last Modified: 2025-01-27 14:19:50.351
Software Version
HEC-HMS version 4.13 beta 4 was used to create this example. You can open the example project with HEC-HMS 4.13 beta 4 or a newer version.
Shared Component Data store several types of data and information used in HEC-HMS simulations. The four types of Shared Component Data are :
- Time-Series Data
- Paired Data
- Grid Data
- Terrain Data
Terrain data is covered in detail in a separate guide, located here: Creating and Linking Terrain Data into a Basin Model. This guide will discuss the other three types of Shared Data.
Tutorials in this guide will aid you in creating Shared Component Data in HEC-HMS by loading real-world data into a watershed model. A watershed model for Mahoning Creek above Punxsutawney, PA is provided below to get you started.

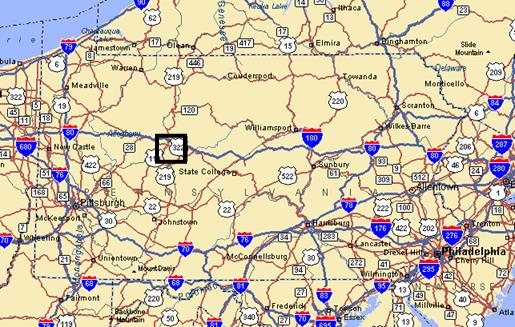
The Mahoning Creek watershed at Punxsutawney, PA is part of the Allegheny River Basin located in western Pennsylvania. The primary conveyance system of this 158 sq. mi. watershed includes the following streams: Stump Creek, East Branch Mahoning Creek, and Mahoning Creek. The confluence of Stump Creek and East Branch Mahoning Creek is located east of the enclave of Big Run. Mahoning Creek is downstream of the confluence. The rectangular box shows the study area.
Below are three guides that will step you through preparing data and creating Shared Component Data necessary for performing a hydrologic simulation.
Project Files
Download initial and final project files for the three tutorials here.
Initial Project Files
Download initial project files for all shared data tutorials here:
Project Files
Download the Final project files for all shared data tutorials here:
Time-Series Data
Time-series data are observations of a hydrometeorological variable that are indexed by time. Common examples include daily average streamflow, fifteen-minute precipitation gage observations, hourly surface temperature measurements, and so on. Frequently, time-series data are used as boundary conditions for a hydrologic simulation.
This tutorial will demonstrate how to create two types of time-series data: precipitation gages, and a discharge gage.
Click here to access this tutorial: Creating Time Series Data
Paired Data
Paired data represent a functional relationship between an x-variable and y-variable so that one variable can be computed from another. Examples include discharge-stage data (rating curves), elevation-storage data (reservoir storage curves), and unit hydrographs.
Click here to access this tutorial: Creating Paired Data
Grid Data
Grid data represent spatial observations on a regular lattice. There are two primary types of grid data: regular grid data, which are an observation of a variable at multiple locations that is not tied to a time of occurrence; and grid sets, which are series of grid observations with regular times of occurrence. An example of a regular grid data is a precipitation-frequency grid, which shows the intensity-duration-frequency relationship for a large area on a grid for a selected frequency. An example of a grid set is a series of 15-minute radar images of precipitation for the duration of a significant storm event, covering the same area.
Click here to access this tutorial: Creating Grid Data
Additional Tasks
Hypothetical Storm Time Patterns
Hypothetical storm modeling in the meteorologic model uses dimensionless time patterns in order to distribute precipitation in time.
Click here to access this tutorial: Creating a Hypothetical Storm Time Pattern Percentage Curve
Continue to Creating Time Series Data
