Download PDF
Download page User Enter Breach Data.
User Enter Breach Data
Global Breach Data
If the "User Entered Data" Breaching Method is selected, then the following data must be entered for the breaching analysis:
More detail on each of these parameters is available here.
The Bold data types below are always visible, others are only available if specific options are selected.
Bold Red data types below tend to be sensitive but uncertain (see inset below).
Some of the data are illustrated in the figure below.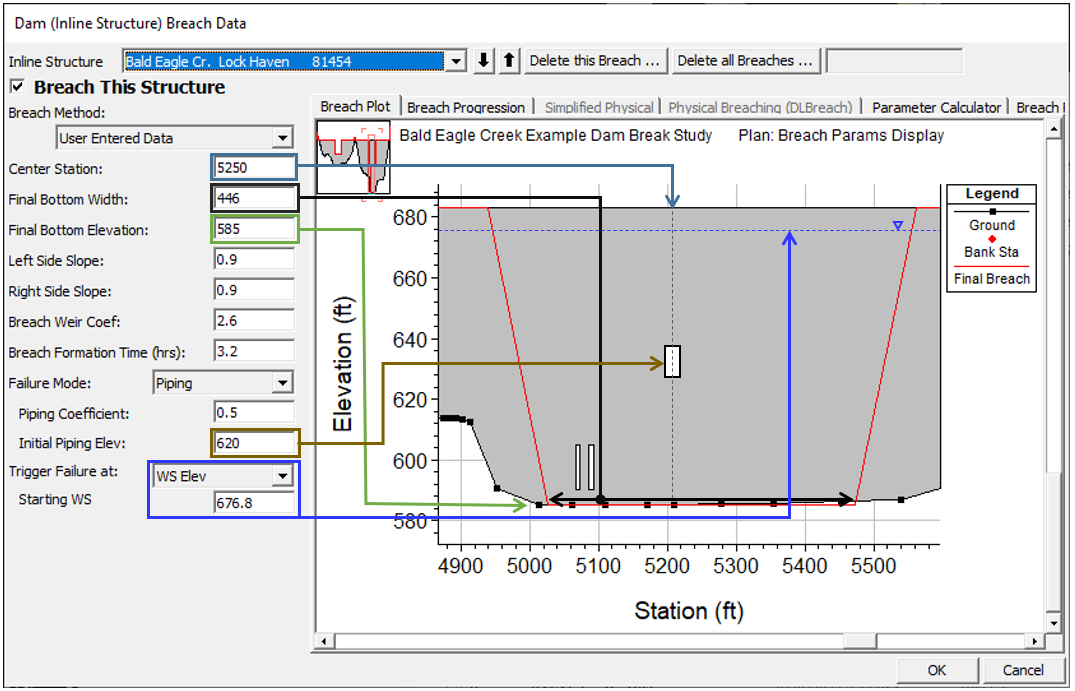
| Data Type | Description | |
|---|---|---|
| Mandatory Data for All User Entered Breach Data Models* |
| |
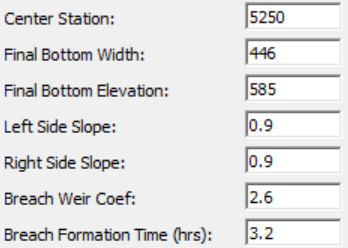
| Center Station | The centerline stationing of the final breach. | |
| Final Bottom Width | The bottom width of the breach at its maximum size. | |
| Final Bottom Elevation | The elevation of the bottom of the breach after it has been fully developed. | |
| Left Side Slope | Left side slope of the trapezoidal breach. | |
| Right Side Slope | Right side slope of the trapezoidal breach. | |
| Breach Weir Coef | The weir coefficient for the breach area. For an overtopping failure, or when the top of a piping failure collapses, the program uses a weir equation to calculate the flow through the breach. Suggested range of values are 2.0 to 3.2, with 2.6 as a default value for most earth dams. | |
| Breach Formation Time | Breach Development Time in hours. Time between the beginning of the breach (i.e. significant erosion) to the full breach development. | |
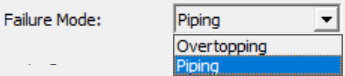
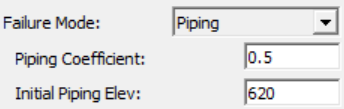
| Failure Mode | Select a failure process. Either Overtopping of Piping. |
|
| Piping-Specific Options and Data | ||
| Piping Coefficient | Orifice coefficient used to compute losses through the "pipe" for the piping failure (before it collapses). Typical Orifice coefficients for an engineered orifice are around 0.8. However, for a piping breach, the coefficient should be lower to represent additional energy losses. |
|
| Initial Piping Elev. | Center of the piping flow when a piping failure develops. | |
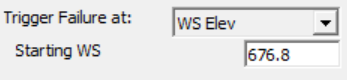
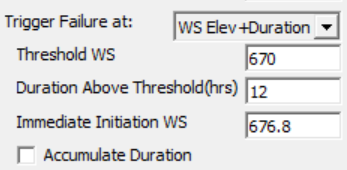
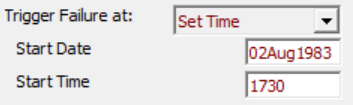
| Trigger Failure At | Select the Method HEC-RAS will use to initiate the breach from the three options below | |
| Trigger Methods | ||
| WS Elev | HEC-RAS starts breaching when the the water surface elevation on one side of the structure reaches the specified value (Starting WS). |
|
| Starting WS | Specify the water surface elevation to start the breach. | |
| WS Elev + Duration | This method assumes that the embankment fails after the water holds a certain elevation for a period of time (e.g. the process requires time to saturate a levee). Therefore it requires an elevation and a duration, and includes a couple additional options. | |
| Threshold WS | HEC-RAS tracks the time that the water surface exceeds this elevation. |
|
| Duration Above Threshold | If the water surface elevation exceeds the Threshold WS (above) for more than this Duration (time in hours) the breach will initiate. | |
| Immediate Initiation WS | This is an "override elevation" that is higher than the Threshold WS. If the water surface elevation exceeds this elevation, than the duration no longer matters. HEC-RAS switches to an immediate failure. This essentially defaults to the WS Elev trigger mechanism if the water gets high enough (e.g. overtopping). | |
| Accumulate Duration | This feature accumulates all time above the specified Threshold WS even it it drops below the threshold in between. If this is off the Duration Above Threshold resets ever time the water surface drops below the threshold. | |
| Set Time | If users know when they want the breach to form, independent of the hydraulics, they can simply set the time. | |
| Start Date | Breach Date in DDMMMYYY format (e.g. 02Aug1983). |
|
| Start Time | Breach Time in 24 hour, 0000 format(e.g. 1730). | |
*Note - Some of these are also required for DLBreach
Select Sensitive and Uncertain Parameters Carefully and Test Their Sensitivity
The Final Bottom Width and the Breach Formation Time tend to be the most speculative of the mandatory parameters, but results can also be very sensitive to them. The other two Breach Methods represent alternate approaches to compute these more theoretically. However, if users are going to select these here, they should test their sensitivity. Empirical equations are available in the Parameter Calculator tab, and more information on selecting these is available here.
Breach Progression
In addition to the User Entered Data in the left pane, the Breach editors have several tabs with additional features and data entry. The first tab (Breach Plot) displays the structure with the outline of the fully developed breach based on the User Entered Data. The second tab includes the Breach Progression data.
By default the breach progression is assumed to be linear (left pane of the figure below) between the breach initiation and the full breach size (Full Formation Time). But breaches tend to start slowly, and finish asymptotically, with the maximum deepening and widening in the middle of the breach. Therefore, users can customize this breach progression. A sinusoidal breach progression is available by simply pressing the Sine Wave button right pane of Figure below). Then the user can adjust this assumption if they have better insight, or input their own breach progression.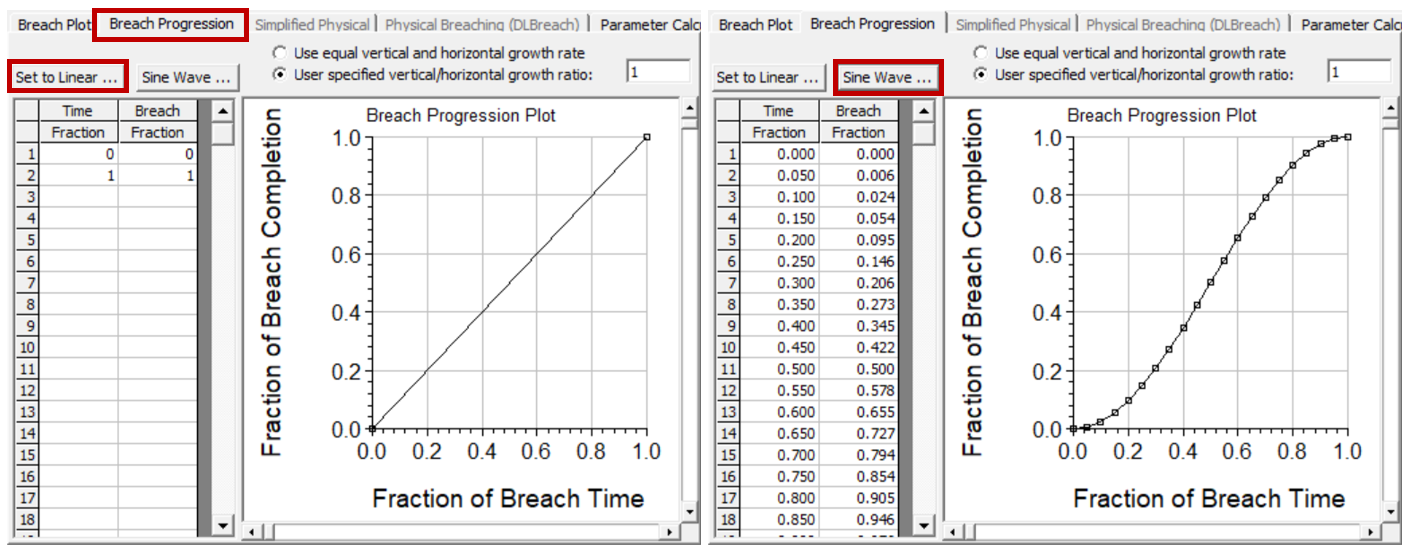
Figure - Dam Breach, Breach Progression Editor with the default, linear, option on the left and the User Specified Sine Wave specified on the right.
The breach progression is defined as a fraction of total breach progression as a function of the total Time (from zero to 1.0). A Breach Fraction of 1.0 is the total Breach Width (the same rate is applied to vertical breach progression - see note below) and Time Fraction of 1.0 is the total Breach Duration Time (hrs). The user-entered curve is plotted in the graphic next to the table. HEC-RAS then uses breach progression curve during the breach formation time to adjust the growth rate of the breach.
While the linear breach progression curve is default, non-linear breach progressions are more realistic.
Versions since 4.2 Use Equal Growth Rates for Breach Downcutting and Widening
Previous to version 4.2, the breach grew vertically and horizontally at rates that reached the maximum breach depth and width at the user entered "Breach Formation Time". For example, if a user entered breach dimensions of 400 ft wide and 100 ft deep, over a period of 2 hours, the horizontal growth rate was 200ft/hr and the vertical growth rate was 50 ft/hr. While this was generally sufficient for Dam breaches, it was not acceptable for levees. Levee breaches are much wider than they are tall. As of version 4.2, RAS computes the breach growth rate to reach the "Final Bottom Width" in the user entered "Breach Formation Time". Then this same breach growth rate is used for the vertical down cutting of the breach. So in the previous example of a 400 ft breach bottom width and a 2 hour breach development time, the growth rate is 200 ft/hr, which is used for both the down cutting and widening rates. The breach will reach the maximum depth in this case, well before it reaches the maximum width, which is common in how levee breaches tend to develop.
User's can change the vertical Breach Growth Rate by entering a value other than 1.0 under the option labeled "User Specified Vertical/Horizontal Growth Ratio" and the Breach Progression Tab. A value of 0.5, that means the vertical growth rate will be half the computed Horizontal growth rate. 
Warning: Breach growth rates after version 4.2 tend to generate larger peak flows.
The breach growth rate change described in the previous paragraph will generally results in RAS version 4.2 and newer yielding a higher peak flow through the breach, than versions 4.1 and older. If the user wants the same results as version 4.1 and older, you must compute a vertical/horizontal growth rate that will results in the breach reaching its maximum width and depth at the end of the breach formation time. For example (assuming an overtopping breach), if you specified a 400 ft breach bottom width and a 2 hour breach formation time, this is a horizontal growth rate of 200 ft/ hour. However, if you Dam is only 100 ft high, then to reproduce the version 4.1 or older results, the user would need to enter a "User Specified Vertical/Horizontal Growth Ratio" of 0.25. This would cause the program to grow the breach vertically down to the 100 ft depth in exactly 2 hours. Piping breaches are more complicated, in that they have an initial elevation for the hole, and the vertical growth is both up and down.
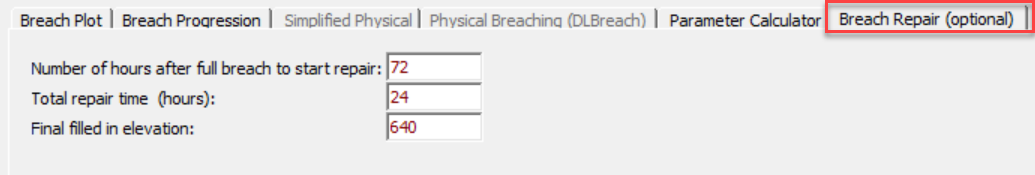
Breach Repair Editor
The fourth Tab on the Breach editor is labeled Breach Repair (Optional). This option allows the user to fill the breach in during the unsteady flow simulation. This could represent emergency management actions, that attempt to fill a breach during an event, or it could represent a repair after the event in a long term simulation. Depending on the length of the simulation, this may be necessary to represent an extended time frame. If this option is selected the user must enter three pieces of information: the number of hours after the full breach to start the repair; total repair time; and the final filled in elevation of the repair work. In general, this option was added for levee breaching analysis, and is not normally used during a Dam Breaching analysis.
Breach Parameter Calculator
The last Tab on the Breach Editor is Labeled Parameter Calculator. This option helps users compute sensitive and uncertain parameters (e.g. Final Width and Breach Duration) based on some physical data about a Dam. This tool uses several regression equations, to compute aproximate Dam Breach bottom Widths, side slopes, and breach development times. Currently the calculator computes these dat with 5 different regression equations, they are: MacDonald et al (1984); Froehlich (1995); Froehlich (2008); Von Thun & Gillete (1990); and Xu and Zhang (2009). More information on this tool is available here.