Download PDF
Download page Task 2. Analyze the Data.
Task 2. Analyze the Data
The Pacific Northwest region (in which the Willamette River watershed resides) is influenced by strong areas of low pressure (mid-latitude cyclones) emanating from the Pacific Ocean. These storms often bring with them high levels of moisture from subtropical sources and active storm dynamics (lift). The combination of enhanced lift and moisture often lead to widespread heavy rainfall that may last three or more days. When these storms are able to obtain high levels of moisture supplied by the subtropical regions in and around the Hawaiian Islands, extreme rainfall can occur. This type of storm scenario is often referred to as an “Atmospheric River”. As the storms approach the Willamette River basin, the precipitation is further enhanced by orographic processes as they move onshore and are forced to rise over the slopes of the coastal ranges and the west slopes of the Cascades. These wintertime synoptic storms, most common from November through March, cover large areas and produce heavy rains over relatively long periods. In addition to liquid precipitation, snowmelt can be a significant contributor to runoff within the Willamette River basin.
Using the tools and approaches that were presented within the Introduction to HEC-SSP workshop, analyze the precipitation and SWE data that was just imported. For instance, try analyzing multiple time series in a single plot. Also, try extracting annual maximum series, filtering the data to different seasons, and/or performing cyclic analyses. A step-by-step guide describing how data sets can be filtered was provided within the Introduction to HEC-SSP Task 8. Create and Parameterize a Distribution Fitting Analysis tutorial. A step-by-step guide describing how to perform a cyclic analysis is included within this tutorial as Task 6. Perform a Cyclic Analysis of the 3-day Precipitation Time Series.
Question 1: What is the maximum 1- and 3-day precipitation accumulations that have occurred within the period of record at Detroit Dam?
The maximum 1-day precipitation accumulation of approximately 2.9 inches occurred in Feb 2014. The maximum 3-day precipitation accumulation of approximately 5.8 inches occurred in Dec 1964.
Question 2: In general, during which times of the year do the largest 1- and 3-day precipitation accumulations occur?
Normal annual precipitation in the Willamette River Basin varies from about 40 inches on the valley floor to about 100 inches in the upper Cascades. Precipitation may occur as rain or snow. Approximately 50 percent of the precipitation at the NWS station occurs in the period spanning November through January, with only 2.5 percent occurring from July to August.
Question 3: What is the maximum SWE that has been recorded at the SNOTEL station within the period of record?
The maximum SWE recorded at the SNOTEL station is approximately 71 inches in late April - early May 2008.
Question 4: When does SWE start to accumulate? In general, during which times of the year do the largest SWE accumulations occur? When does SWE typically melt out?
SWE typically starts to accumulate in late October or Early November while the largest magnitudes are generally achieved in mid to late April. SWE completely melts by late May or early June.
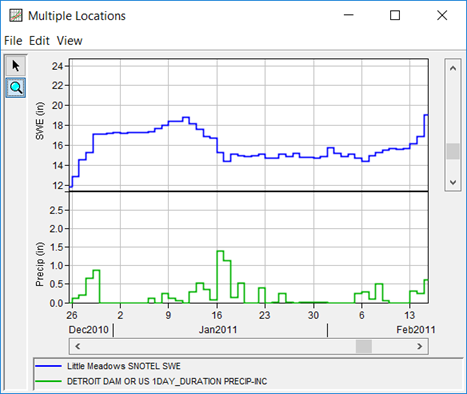
Question 5: In January 2011, SWE was reduced by over 4 inches in a little over a week. What is the likely cause of this quick reduction in SWE? Provide evidence of your claim. Can you find evidence of similar events throughout the period of record?
This reduction in SWE over a short time period is likely due to a rain-on-snow event, as shown in Figure 1. There are similar events that have occurred in December 1996, January 2001, December 2007, and November 2017.
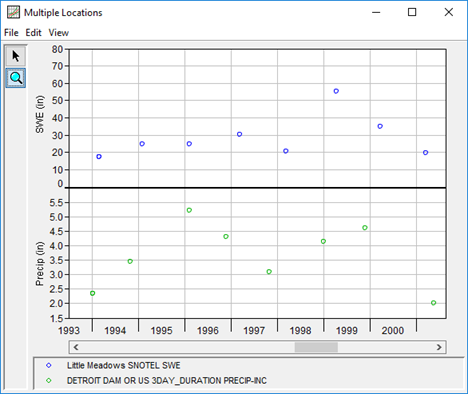
Question 6: In general, does the annual maximum precipitation accumulation align temporally (i.e. in time) with the annual maximum SWE?
No. In general, the peak rainfall intensities/accumulations in a given year occur earlier in time than the peak SWE accumulations at these two locations. This is made evident by extracting the all-season annual maximum series of both SWE and precipitation and plotting them together, as shown in Figure 2. For all but a few years, the annual maximum precipitation accumulations occur several months before the annual maximum SWE. However, within water year 1996, the annual maximum SWE occurred slightly earlier than the annual maximum precipitation. Also, the entire Willamette River watershed (and several others along the Pacific Ocean) was subjected to one of the largest floods within recorded history during that time. During this event, large amounts of precipitation accumulated while temperatures were also high which caused significant snowmelt. So much SWE was melted in this water year that the annual maxima occurred much earlier than normal (i.e. there wasn’t enough precipitation left to make up for the amount of melt that occurred).
Question 7: If peak SWE and precipitation magnitudes are not aligned in time, what type of flood producing mechanisms (i.e. rain-on-snow, etc.) could be realized within the Willamette River watershed? Do you think that specific seasons or times of year are more susceptible to certain mechanisms than others?
In the Willamette River watershed, floods are primarily due to winter rain-on-snow or spring snowmelt events.
Winter rain-on-snow floods are characterized by high peak discharges and are usually of short duration, typically lasting about five days. These winter rain-on-snow floods normally occur within the period spanning November through March and are caused by intense rains oftentimes augmented by snowmelt.
Storm events in the spring usually result from melting snow in the absence of heavy precipitation. While peak discharges of spring snowmelt events are usually lower than winter rain-on-snow events, the runoff volumes due to spring snowmelt can be very large.
Quality assurance and quality control (QA/QC) of data is incredibly important. This is especially true when the measurement/inference accuracy of the actual variable(s) of interest becomes less reliable as the magnitude increase, as is the case with common statistical hydrology applications such as peak flow-frequency and/or precipitation-frequency. No data QA/QC was performed within this workshop due to time constraints. However, these processes should always be performed within statistical applications.
Continue to Task 3. Fit and Compare Multiple Models to the Winter Season 3-day Precipitation Time Series.