Hydrograph Locations and Parameters
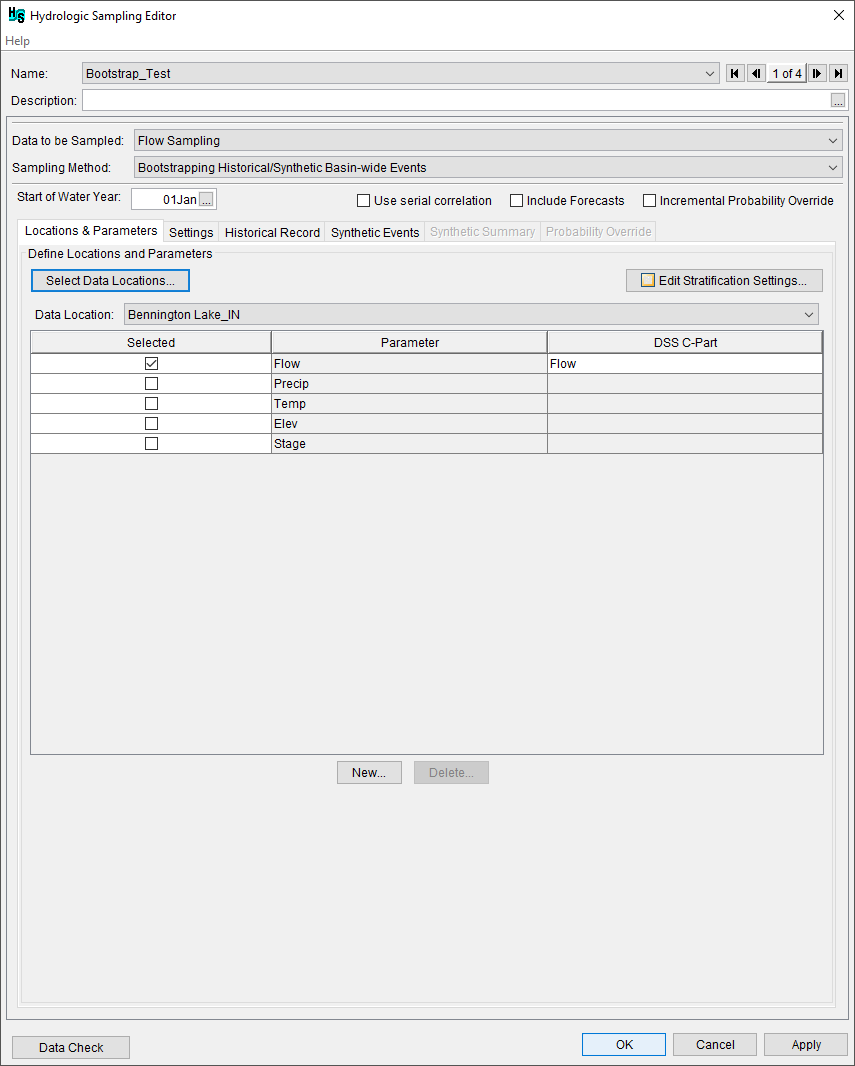
From the Settings tab hydrograph locations are selected; ranking of the historical record events, uncertainty method, and define the exceedance probability of the synthetic events are available from the Locations and Parameters tab. If the Include Forecasts option (review Selecting Bootstrapping Historical/Synthetic Basin-wide Events method) has been selected, forecast sampling parameters for hydrograph locations are entered on the Forecasts tab of the Settings tab (see Ranking Events, Uncertainty Method, and Synthetic Event Probabilities (Settings tab)).
Selecting Locations
Select the required data locations, from the Locations and Parameters tab, click Select Data Locations, the Selection Editor will open. Select data location(s) from the Available Locations list individually (e.g., Mill Creek at Five Mile Road), or select multiple locations while holding down the Ctrl key, click Add, this will move the selected location(s) to the Selected Locations list. Add All moves all locations from the Available Locations list to the Selected Locations list. Alternatively, double-clicking on a desired location (e.g., Hilldale) will move the location form the Available Locations list to the Selected Locations list. To remove locations from the Selected Locations list, select a location, either click Remove for individually selected locations, or click Remove All to remove all selected locations from the Selected Locations list, and move the locations back to the Available Locations list.

Selecting Parameters
Once a Data Location has been selected, Parameters can be associated with it in the Define Locations and Parameters panel. A parameter represents a measured value at that location, such as flow for a timeseries of flow at a streamgage. Multiple parameters may be selected at a location. Additional parameters beyond the defaults can be added with the New... button or removed with the Delete... button. To include a given location and parameter combination in the historic record and synthetic events to be sampled, it must be checked under the Selected column. A drop-down menu at the top allows the user to select each data location and then identify the sampled parameters at each.
The ouput from the Hydrologic Sampler will be assigned a DSS pathname using the Location and Parameter names for the pathname's B part and C part. Optionally, the DSS C-Part may be changed, which will be assigned to the output data when the sampled data is loaded in the simulation's DSS file.

Stratified Sampling
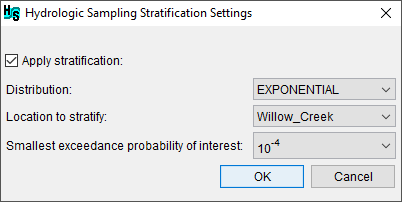
Stratified sampling in the Hydrologic Sampler changes the distribution of points along the frequency curve sampled. This sampling method can be used to increase emphasis in samples along a certain portion of the frequency curve, reducing the number of total events needed to represent the upper end of the curve. By default stratified sampling is turned off and any point along the frequency curve is equally likely to be sampled (equivalent to a uniform distribution). However, when stratified sampling is turned on the probabilities sampled along the frequency curve are weighted by a distribution identified by the user.
To enable stratified sampling and change the settings, click the Edit Stratification Settings button to open the Hydrologic Sampling Stratification Settings dialog. Check the Apply Stratification checkbox to turn on stratified sampling and select a distribution (Gumbel (EV1), Normal, Half-Normal, Exponential, and Uniform) and the location to apply stratified sampling to. The parameters for each distribution predefined and cannot be modified by the user. The Smallest exceedance probability of interest setting is used to set the probability at which the final stratification bin should begin.

Stratified sampling divides the frequency curve into bins based on the distribution selected and smallest exceedance probability of interest. The number of bins are determined by the number of events within the lifecycle (number of years the analysis period spans). For example a 50-year analysis period will include 50 bins in the stratification. This process ensures that each lifecycle has a sample in every bin. Over the course of generating a set of sampled events in a lifecycle, each bin is sampled in order. The width of each bin is used in re-aggregation and summarization of model results. The probability of each bin is saved to a paired data record in the output variable DSS file for the compute.
Note
Stratified sampling is not recommended with the bootstrap sampling method, and should only be used in bootstrap sampling with a very large number of synthetic events defined. Otherwise, a single event will frequently fill one or more bins and the benefits of stratified sampling may be lost.
If the Edit Stratification Settings button does not display a checkmark then the Apply stratification checkbox in the Hydrologic Sampling Stratification Setting dialog box was not checked.
Removing Locations
Note, users can add or remove hydrograph locations at any time. However, if users attempt to remove hydrograph locations, a Location Selection Warning message window will open, which requires users to confirm the deletion of the selected hydrograph location(s) and all related information. Furthermore, for users editing an existing hydrologic sampling alternative when forecast locations have been selected (review Sampling Forecast Uncertainty), these locations are displayed with "~FCST:" in front of the location name at the bottom of the Selected Locations list. The "~FCST:" indicates that those locations were already selected as hydrograph locations as well as forecast locations. Following the successful selection of the hydrograph location(s), click OK, and the Selection Editor will close.
