Task 1: Compute the Snowmelt HEC-HMS Forecast Alternative
Compute the HEC-HMS Forecast Alternative
- Begin by opening HEC-HMS and the NAB_Upper_Susquehanna HEC-HMS project. (Located in the CWMS_Class\StandAloneWorkshops\NAB_Upper_Susquehanna folder)
- Expand the Basin Models node and select the Winter_Forecast_Snow basin model. This will display the basin model within the Desktop.
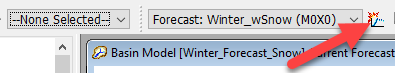
- Select the Forecast: Winter_wSnow (M0X0) forecast alternative from the drop-down menu at the top of the HEC-HMS window.
- Click the Compute button, as shown in the figure below.
- Messages will display detailing the HEC-HMS compute process (messages and warnings). The compute should require approximately 30 seconds to complete.
Review the Results
Once the HEC-HMS alternative has successfully computed, compare the results at various locations to determine how well the model did.
- Begin by comparing the observed flow and/or stage against the computed results at several locations, including Cincinnatus, Whitney Point Dam, and East Sidney Dam.
- These locations are shown in the following figure.

- These locations are shown in the following figure.
In general, how do the initial computed flow and/or stage results (i.e. uncalibrated) compare against the observed results? What modifications should be made to provide a better match?
They are not bad, but there are noticeable differences. Loss rates, transform, baseflow, and snowmelt/accumulation parameters could be adjusted to calibrate the model to better match observed data.
Continue by comparing HMS-computed SWE against SNODAS results.
- Click on the Oaks_S10 subbasin element in the Watershed Explorer.
- Within the basin model map, right-click on the subbasin polygon, choose View Results, and then select Snowmelt Graph. You should see a plot that looks like the following figure.

What does the observed SWE data (SNODAS time series) actually represent? What do you think represents "good agreement" within these types of comparisons? What can be done to make the compute results better align with the "observed" SWE?
The SNODAS time series (i.e. “observed” SWE data) represents basin-average model results, which is similar to the HMS-computed SWE. Generally speaking, the rate of melt and accumulation is an important factor to consider when calibrating snowmelt/accumulation simulations. Also, the time of melt is important to match.