Viewing Results
Simulation results can be viewed in several internally generated reports. The next few sections outline the general properties of the available reports. When a simulation is run in HEC-FIA, a file structure is developed to store the results (review Project Files for project directory structure). The file structure begins in the root directory with the runs sub-directory, the next folder in the sub-directory is the alternative name, followed by a subfolder with the event name, and finally a subfolder with the time window name. Inside of the last folder are the results from that simulation.
The Content Pane displays this general folder structure when the simulation is selected in the study window. When the node named by the time window is right-clicked (e.g., BaseTW in figure ), the user receives the options for results reporting available based on the selections in the alternative.
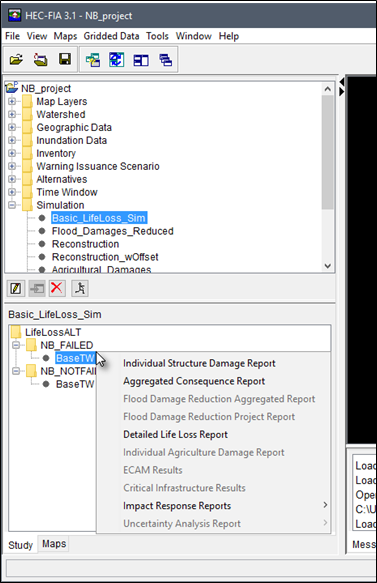
Figure: Simulation - Content Pane - Event Results Shortcut Menu
Individual Structure Damage Report
To view individual structure damage results:
- From the Content Pane, information about the simulations that have been computed is available. Under each alternative name, is a list of associated events. Under each event is a list of time windows. By right-clicking on a time window name, the Results shortcut menu appears displaying the available reports.
- The Individual Structure Damage Report dialog box opens.
This report contains a row for each structure damaged by the event. Notice that there are more columns available than are shown in the default window. To access the additional rows the user can expand the width of the report, or scroll using the horizontal scroll bar.
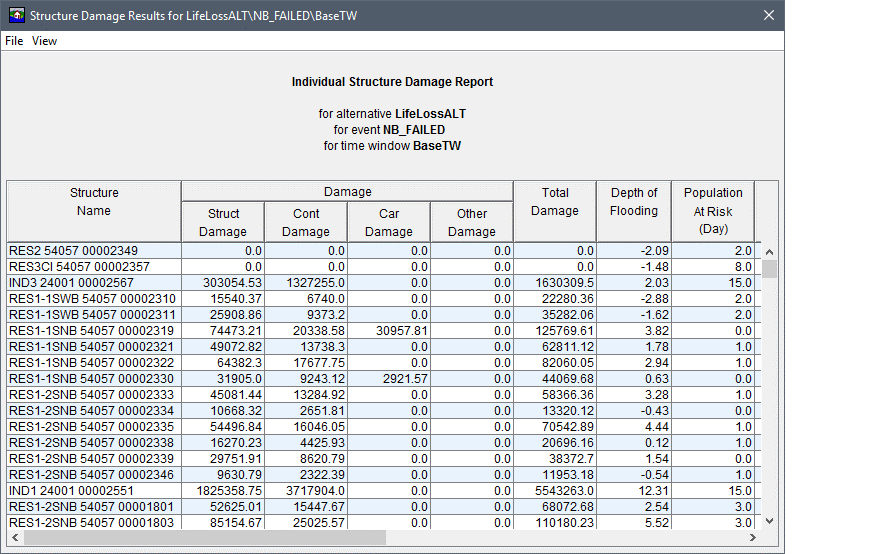
Figure: Example - Individual Structure Damage Report- Default View
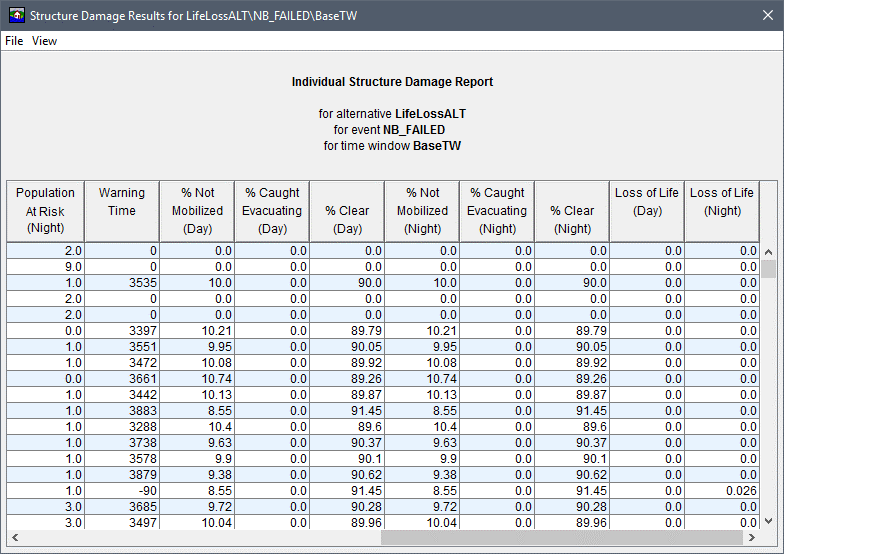
Figure: Example - Individual Structure Damage Report - Scrolled View
- If the user selects the row of a structure of interest (or group of structures), the option to zoom to those structures in the map window is possible by right-clicking on one of the selected rows and clicking Zoom to Structures from the shortcut menu.
- The columns can be sorted in descending order by clicking on the header of the column. To reverse the sorting order, click the header a second time.
- Unless the table is sorted in descending order, the final row in the table provides the total values in each column.
Aggregated Consequence Report
The Aggregated Consequence Report sorts the computed impacts by emergency planning zone, damage category, occupancy type, or any boundary polygon (e.g., counties in the study area or holdout areas) the user wishes to aggregate the results (if the polygon has been added as boundary data).
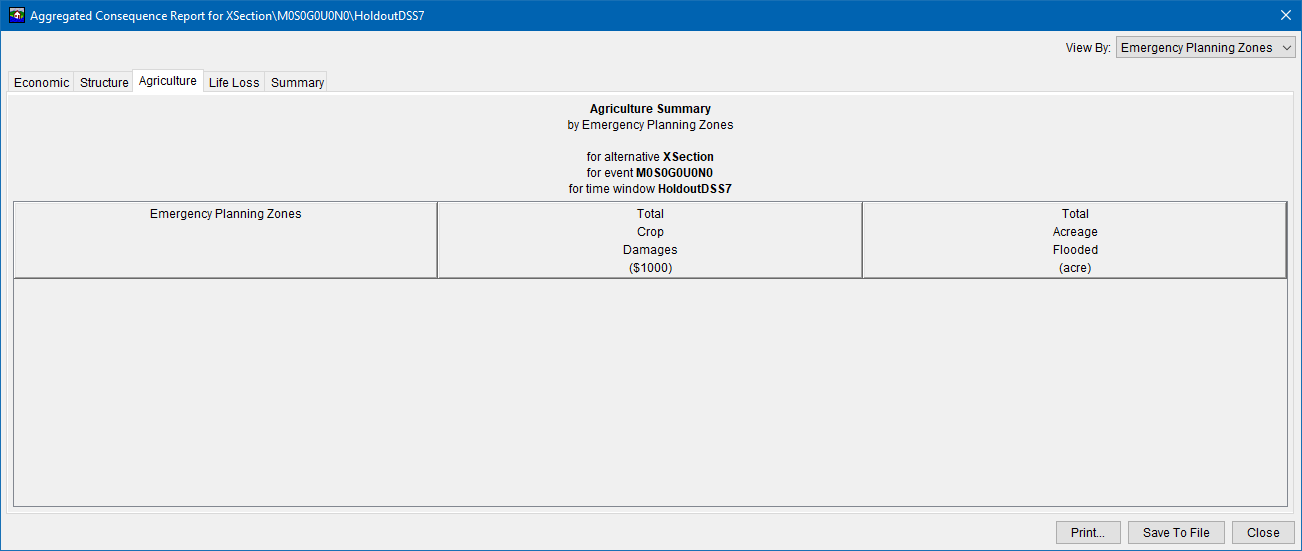
Figure: Example - Aggregated Consequence Report
To view the consequences of the modeled event as an aggregated report summarized in tabular format:
- With a simulation selected from the Study Tree, from the Content Pane, right-click on a time window, from the shortcut menu, click Aggregated Consequence Report.
- The Aggregated Consequence Report opens.
- The report has a title block explaining what is being reported. The first line in the title block is a description of the type of data, and is based on which tab (Economic, Structure, Agriculture, Life Loss, or Summary) has been selected. The second line is based on the option selected from the View By list, which governs how the data is aggregated. The remaining lines define the alternative, event and time window used to produce these specific results.
- To aggregate the results based on any polygon shapefile, the shapefile must be added to the HEC-FIA study as boundary data (review Boundaries), the boundary appears in the View By list. If the user selects the boundary, the data is processed to represent all points within the polygons that make up the polygon shapefile. Additionally, the report can be displayed using attributes available in the results shapefile such as Emergency Planning Zone, Damage Category or Occupancy Type.
- New as of HEC-FIA Version 3.4, if the Economic or Structure compute types were not included in the simulation, that corresponding tab is now blank instead of showing zero values. This clears up confusion where the user sees zero values for a compute that didn't actually occur. The image below shows the Agriculture Aggregated Consequence Tab for a simulation that did not include Agriculture.
Flood Damage Reduction Reports
To view the flood damage reduction reports, the simulation must contain the proper alternative, event, time window combination for a Flood Damages Reduced compute. This requires the event to have the necessary hydraulic data (review holdout inundation configuration described in Inundation Data), and the alternative to be set to use the holdout inundation configuration (review Compute Options for an Alternative). If the alternative is not set up properly then the flood damage reduction reports are not enabled.
Flood Damage Reduction Aggregated Report
There are two report options for the flood damages reduced simulation. The first option is to view the damage reduction estimates as an aggregated report. The aggregated report sorts the computed impacts by holdout distribution area (when included), damage category, occupancy type, or any boundary polygon (e.g., counties in the study area) the user wishes to aggregate the results (if the polygon has been added as boundary data).
To view the flood damage reduction estimates as an aggregated report:
- From the Content Pane , right-click on a time window, from the shortcut menu, click Flood Damage Reduction Aggregated Report.
- The Flood Damage Reduction Aggregated Report opens.
- With the introduction of the Agriculture Flood Damages Reduced compute the Flood Damage Reduction Aggregated Report has been improved. It now includes additional Tabs for Agriculture Damage, Agriculture Acreage, and an overall Total Tab.
- If Agriculture was not computed, both the Agriculture Damage and Acreage Tabs will be blank.
The View By list governs how the damage reduction is aggregated in the report (by default Holdout Distribution Area is selected). To aggregate the results based on any polygon shapefile, the shapefile must be added to the HEC-FIA study as boundary data (review Boundaries), and the boundary appears in the View By list.
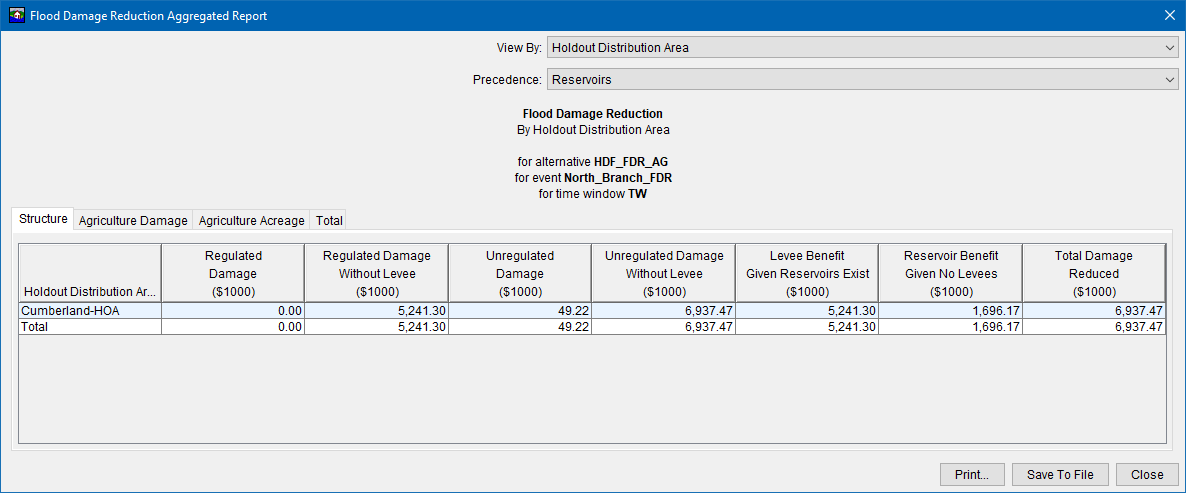
Figure: Example - Flood Damage Reduction Aggregated Report - Default View
If the user selects the boundary, the data is processed to represent all points within the polygons that make up the polygon shapefile. Additionally, the report can be displayed using attributes available in the results shapefile such as Holdout Distribution Area, Damage Category or Occupancy Type. The Total Tab sums the Damages Reduced for both Structures and Agriculture Damage. Note that this tab can only be viewed by geographical categories such as Emergency Planning Zone or other shapefiles. If the user attempts to view by Damage Category or Occupancy Type the Total Tab will be blank.
- The next level of the report options provides the Precedence in the structure damage reduction allocation by Levees or by Reservoirs (default selection). The precedence selection updates the Levee Benefit and Reservoir Benefit columns.
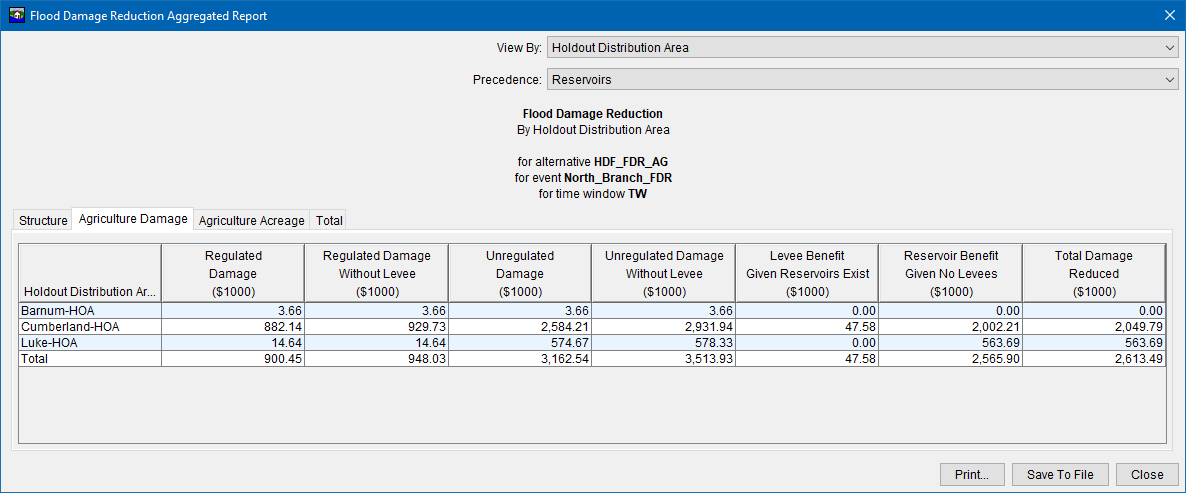
Figure: Example - Flood Damage Reduction Aggregated Report - Agriculture Damages Tab
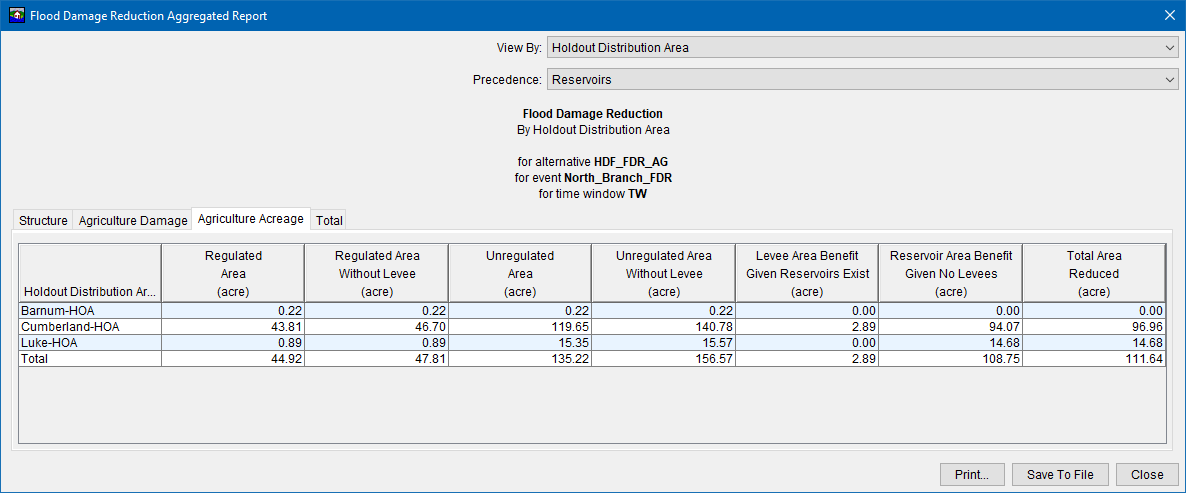
Figure: Example - Flood Damage Reduction Aggregated Report - Agriculture Acreage Tab
Flood Damage Reduction Project Report
The second report option for the Flood Damages Reduced simulation is to view the damage reduction estimates by project. The project report sorts the computed impacts by project, which can be further apportioned by any boundary polygon (e.g., counties in the study area, holdout areas) the user wishes to apportion the results (if the polygon has been added as boundary data).
To view the flood damage reduction estimates reported by project:
- From the Content Pane, right-click on a time window, from the shortcut menu, click Flood Damage Reduction Aggregated Report.
- The Flood Damage Reduction Project Report opens.
- The View By selection list governs how the damage reduction is grouped in the report (e.g., Project, selected by default). To apportion the results based on any polygon shapefile (e.g., counties), the shapefile must be added to the HEC-FIA study as boundary data, the boundary appears in the View By list. If the user selects the boundary, the data is processed to represent all points within the polygons that make up the polygon shapefile. The report table updates with an additional column for the selected boundary attributes.
The next level of the report provides the Precedence in the structure damage reduction allocation by Levees or by Reservoirs (default selection). The Damage Reduced column updates based on the Precedence dropdown list selection.
If Agricultural Flood Damages have been calculated, the Report will automatically expand to include columns for Agriculture Damages Reduced and Total Damages Reduced.

Figure: Example Flood Damage Reduction Project Report

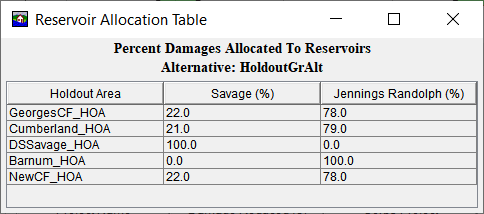
The Show Reservoir Distributions button brings up a Reservoir Allocation Table showing how flood damages reduced were distributed between each of the reservoirs in the model for each of the holdout areas.
Detailed Life Loss Report
To view the detailed life loss report, the alternative, event, time window combination must be set up to run life loss. This requires the event to have the necessary hydraulic data, and the alternative to be set to compute life loss. If the alternative is not set to compute life loss, this report is not enabled.
To view the detailed life loss report:
- From the Content Pane, right-click on a time window, from the shortcut menu click Detailed Life Loss Report.
- The Detailed Life Loss Report opens.
The Detailed Life Loss Report provides information about how HEC-FIA calculated life loss for the study area. The report aggregates data to explain how life loss was computed. When computing deterministic runs, the results are deterministic, when computing Monte Carlo runs, the results represent averages.

Figure: Example - Detailed Life Loss Report
- The View By selection list governs the category grouping for the life loss report (e.g., Total, selected by default). Additionally, the report can be displayed using attributes available in the results shapefile such as Emergency Planning Zone, Damage Category or Occupancy Type; or by a polygon shapefile (e.g., counties).
To group the results based on any polygon shapefile, the shapefile must be added to the HEC-FIA study as boundary data, the boundary appears in the View By list. If the user selects the boundary, the data is processed to represent all points within the polygons that make up the polygon shapefile.
Individual Agriculture Damage Report
To view the individual agriculture damage report, the alternative, event, time window combination must be set up to run an agriculture compute. This requires the event to have the necessary hydraulic data, and the alternative to be set to compute agricultural damages (as described in Agriculture Compute Tab). If the alternative is not set to compute agricultural damages, this report is not enabled. To view the report:
- From the Content Pane, right-click on a time window, from the shortcut menu click Individual Agriculture Damage Report.
The Individual Agriculture Damage Report opens. The final row in the table provides the total damage and acreage values.
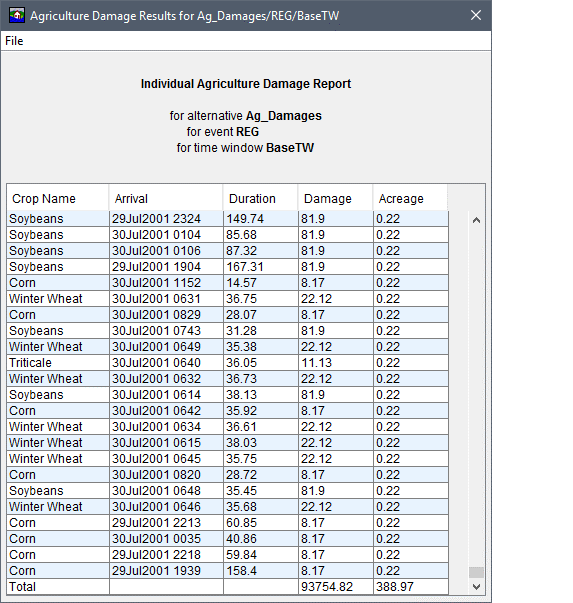
Figure: Example - Individual Agriculture Damage Report
ECAM Results
The ECAM report is only enabled if the alternative, event, time window combination has been set to run life loss and ECAM. If those conditions are met, the output for ECAM is written during the compute, and the report is enabled. This report has two tabs, one representing the changes in the output of the economy, the other representing the changes in labor employed by the sectors for the county. Each tab reports at the sector level for the selected county.
- From the Content Pane, right-click on a time window, from the shortcut menu click ECAM Results.
The ECAM Indirect Economics Output Report opens.
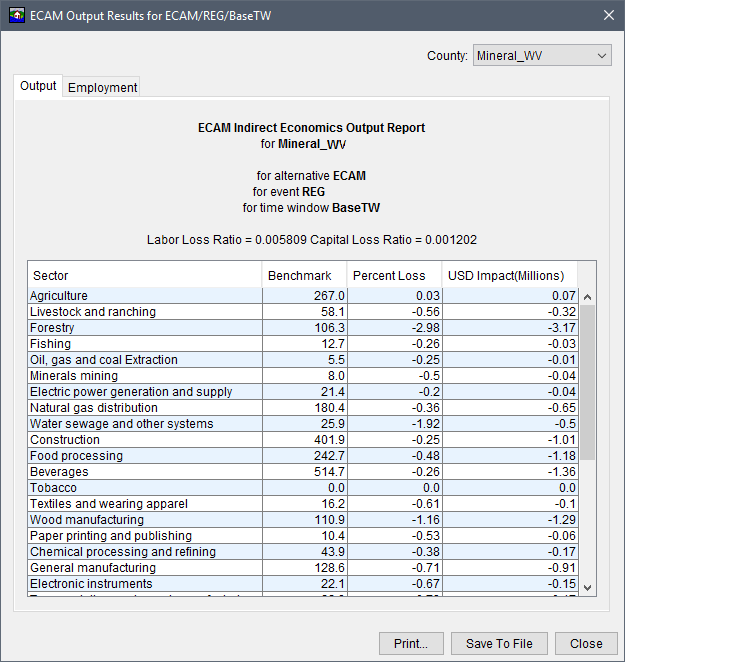
Figure: Example - ECAM Indirect Economics Output Report
- The report has a title block explaining what is being reported. The first line in the title block is a description of the type of data, and is based on which tab (Output or Employment) has been selected. The second line is based on the county selected in the County list. The next three lines define the alternative, event and time window used to produce these specific results. The final line in the title block contains the labor loss and capital loss ratios.
- The columns can be sorted in descending order by clicking on the header of the column. To reverse the sorting order, click the header a second time.
- Unless the table is sorted in descending order, the final row in the table provides the total values in each column.
Critical Infrastructure
Critical infrastructure results are available if the alternative, event, time window combination has a critical infrastructure inventory defined in the alternative. The report only includes critical infrastructure elements which were inundated by the event based on the user defined elevation, or the elevation of the terrain grid.
- From the Content Pane, right-click on a time window, from the shortcut menu click Critical Infrastructure Results.
The Critical Infrastructure Report opens.

Figure: Example - Critical Infrastructure Report
- The report has a title block explaining what is being reported. The remaining lines in the title block define the alternative, event and time window used to produce these specific results. The columns can be sorted in descending order by clicking on the header of the column. To reverse the sorting order, click the header a second time.
Impact Response Reports
If an impact response element is defined in the alternative, an impact response report is available whether or not the thresholds were exceeded. There are three ways to view the impact response reports: by rule, by location, and summary. The option to view the impact response By Rule and By Location displays the hydrograph at the location of the rule, and the threshold elevation relative to the hydrograph, if no threshold is exceeded, the summary will declare that the criteria was not met.
Impact Response Rules Report
The By Rule report displays each rule independently. To view the impact response reports, by rule, with a simulation selected from the Study Tree, from the Content Pane, right-click on a time window, from the shortcut menu, point to Impact Response Reports and click By Rule.
The Impact Response Report opens for rules. The report has a dropdown list and navigation buttons at the top to allow users to select different rules. The plot, impact and response panels update based on the selected rule.
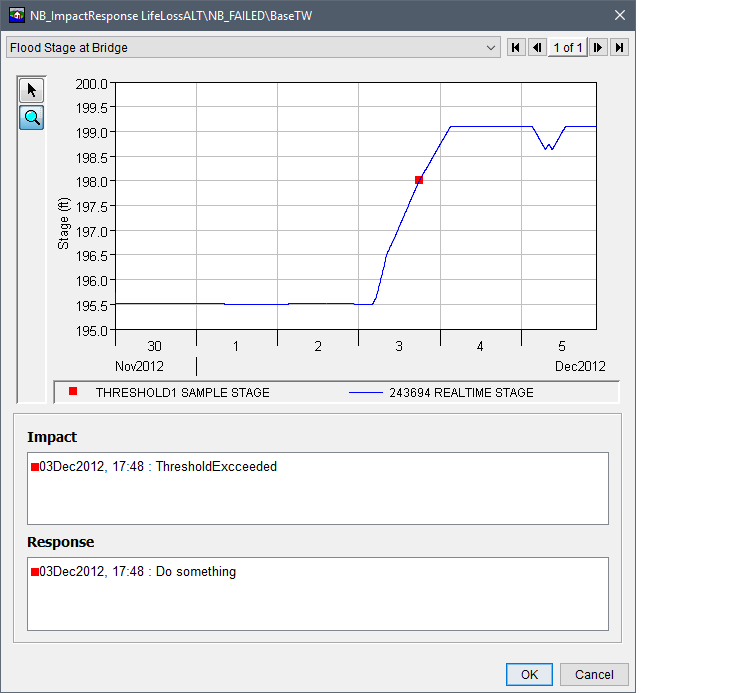
Figure: Example - Impact Response Report - By Rule
Impact Response Location Report
To view the impact response reports, by location, with a simulation selected from the Study Tree, from the Content Pane, right-click on a time window, from the shortcut menu, point to Impact Response Reports and click By Location. The Impact Response Report opens for locations. This report option displays impact response information by each location that has been defined in the impact response rules set; if there are many rules for one location, then the rules are displayed together.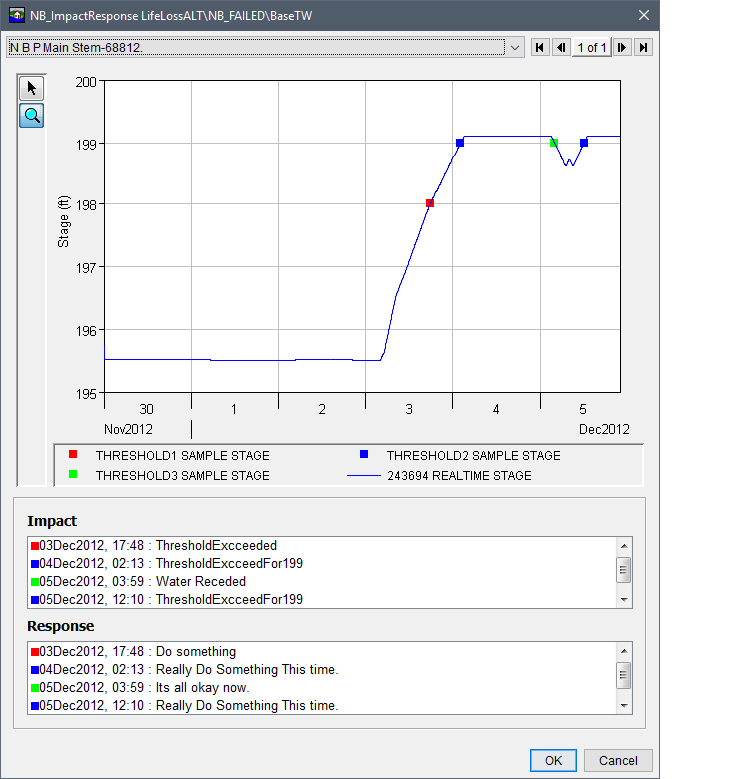
Figure: Example - Impact Response Report - By Location
Impact Response Summary Report
To view the impact response summary report, with a simulation selected from the Study Tree, from the Content Pane, right-click on a time window, from the shortcut menu, point to Impact Response Reports and click Summary. The summary report opens and displays all rules that were applied and the number of times the threshold conditions were met. The appropriate impact and response is defined each time a threshold is met.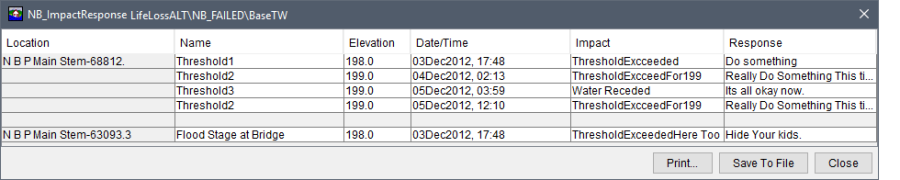
Figure: Example - Impact Response Report - Summary
Uncertainty Analysis Reports
The uncertainty analysis reports can be viewed two different ways: through Results by Iteration, or Life Loss By Warning Issuance plots. These plots provide the results by iteration; therefore, the number of iterations computed is dictated by the Monte Carlo iteration controls set by the user in the alternative editor.
Uncertainty Analysis Results By Iteration
To view the uncertainty analysis results by iteration:
- From the Content Pane, right-click on a time window, from the shortcut menu, point to Uncertainty Analysis Report, and click Results by Iteration.
- The Results by Iteration report opens.
The report displays a paired data record with an output variable for each iteration in the Monte Carlo compute. To view values that were sampled to produce the output, the user must first check the option in the Uncertainty tab of the alternative editor, and then view the output HEC-DSS file using HEC-DSSVue. The output variable displayed in the plot can be changed by selecting a different item from the Variable list.
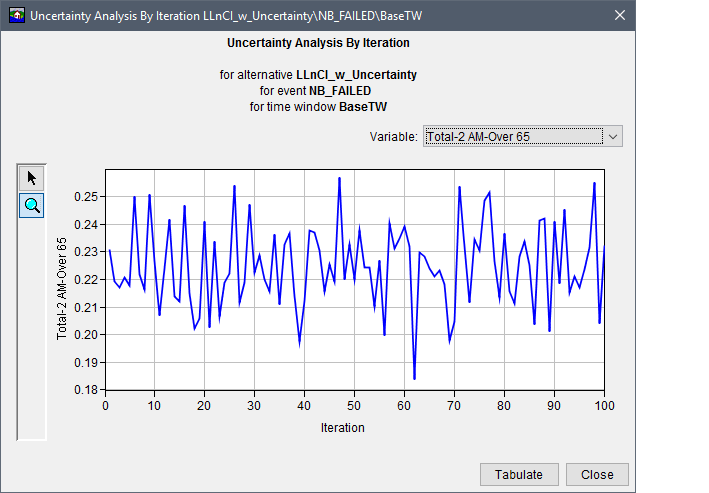
Figure: Example - Uncertainty Analysis By Iteration Report
Uncertainty Analysis Results By Warning Issuance
To view the uncertainty analysis results for life loss by warning issuance (review Create a Warning Issuance Scenario):
- From the Content Pane, right-click on a time window, from the shortcut menu, point to Uncertainty Analysis Report, click Life Loss By Warning Issuance.
- The Life Loss by Warning Issuance report opens.
This report displays a point graph which plots warning issuance time on the x-axis, and life loss on the y-axis for each iteration Monte Carlo output. The time of day displayed in the plot can be changed by selecting a different time from the Time Of Day list. Note, the available items in the Time Of Day list is dependent on the computation times set by the user from the alternative editor.

Figure: Example - Uncertainty Analysis By Warning Issuance Report