Managing Schematic Layers
HEC-WAT creates schematic layers when a user creates a stream alignment, schematics, alternatives, and simulations. These schematic layers appear in the Maps tab. Depending on which type of map window is open, the user will be able to access different schematic layers. The information below shows the user how to manage schematic layers.
Stream Alignment Layer
The Stream Alignment map layer contains the stream alignment that was imported or digitized and is opened in the active map window (selected in the Desktop Pane). Access for the Stream Alignment map layer is from the Maps tab, from the Map Layers Tree, and is available from all map window types. This layer has sub-layers for each stream alignment element, and can be accessed by expanding the tree for the Stream Alignment map layer. To expand the tree, click the plus ![]() sign; to collapse the tree, click the minus
sign; to collapse the tree, click the minus ![]() sign.
sign.
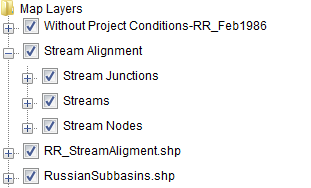
When the tree is expanded, the three different sub-layers (stream junctions, streams and stream nodes) for the stream alignment layer are visible. Streams in a stream alignment is a layer containing multi-segmented line(s) with beginning and ending stream nodes. The Stream Node sub-layer contains points for each location (a smaller dark green circle) on a stream that provides stream stationing information. By default, HEC-WAT creates two automatically (at the beginning and ending of the stream segments), and a user can add stream nodes to a stream. The Stream Junctions sub-layer contains points for each location where two streams connect, and is represented by a light-green (larger) circle on the orange stream alignment. If the user does not want to see the stream junctions for the entire stream alignment, uncheck ![]() the Stream Junctions checkbox, and the stream junctions will no longer be visible in the active map window. To view the stream junctions, check
the Stream Junctions checkbox, and the stream junctions will no longer be visible in the active map window. To view the stream junctions, check ![]() the Stream Junctions checkbox. This procedure applies to all of the sub-layers.
the Stream Junctions checkbox. This procedure applies to all of the sub-layers.
Stream Alignment Shortcut Menu
The shortcut menu for the Stream Alignment map layer is accessed by right-clicking on the stream alignment map layer in the Map Layers Tree, in the Maps tab. The shortcut menu provides several ways to manipulate the Stream Alignment map layer. The available commands are:
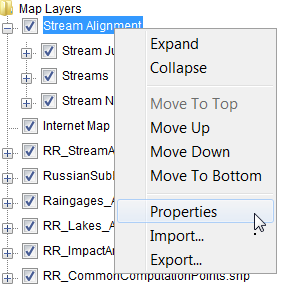
- Expand – expands the Stream Alignment map layer's tree; the tree provides information on the available elements of the stream alignment.
- Collapse – collapses the Stream Alignment map layer's tree; the tree provides information on the available elements of the stream alignment.
- Move to Top – moves the Stream Alignment map layer to the top of the tree.
- Move Up – moves the Stream Alignment map layer up the tree one position.
- Move Down – moves the Stream Alignment map layer down the tree one position.
- Move to Bottom – moves the Stream Alignment map layer to the bottom of the tree.
- Properties – opens the Stream Alignment Properties dialog box (discussed in detail in the next section) allows the user to edit properties of the elements that are part of the Stream Alignment map layer.
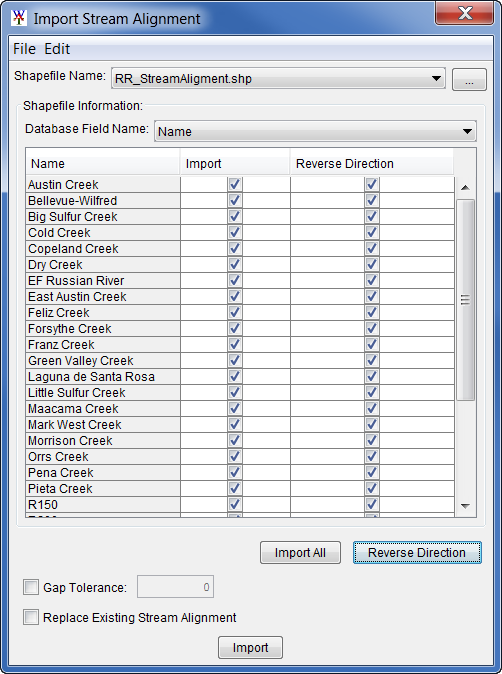
- Import – allows the user to import a stream alignment from a shapefile that has already been added to the project. From the Import Stream Alignment dialog box, the user will select a shapefile (polyline) and then import that shapefile, creating a stream alignment.
- Export – allows the user to export the stream alignment to a shapefile. A Save browser will open, browse to the location on the computer where the shapefile is to be copied. Click Save, the Save browser will close and a shapefile of the stream alignment will be saved.
Adjust the Stream Alignment Properties
For the Stream Alignment map layer, the user can configure the appearance of the streams and their labels, configure the appearance of the stream junctions and stream nodes, and set the visualization scaling for the Stream Alignment map layer. To configure these properties, from the Maps tab, right-click on Stream Alignment. From the shortcut menu, click Properties, and the Stream Alignment Properties dialog box will open.

Streams
To change the appearance of all streams in the map window:
- The user can set the width of the lines that represent the streams in the stream alignment from the Stream Alignment Properties dialog box from the Stream Width list.

- The color of the lines that represent the streams in the stream alignment can be changed from the Stream Color list. The default color is orange, there are several colors to choose from, plus the user has the ability to create colors. From the Stream Color list, click Custom, the Choose A Color dialog box will open. The Choose A Color dialog allows the user to select a color using one of the available methods (e.g., from a selection of default color swatches; a hue, saturation, brightness (HSB) model; from a red, green blue and alpha (RGBA) color model).

- Either changing the width or color of the streams, can be previewed in the example to the right of the Edit Properties box. For the changes to appear in the map window, click Apply, and the map window will update.

- By default, the labels for the streams appear in the active map window. If the user does not want the labels displayed, clear Show Stream Name; click Apply, stream labels no longer display in the map window.
- To change the font of the stream labels, click Choose Font, next to Show Stream Name. A Font Chooser opens, select the font type from the Type list, and select a size using the Size slider. Click OK, the Font Chooser closes, from the Stream Alignment Properties dialog box, click Apply, the stream labels display in the font and size chosen.

- Tic marks appear on a stream representing the stream stationing of the stream. There are two types of tic marks – minor and major. To change the appearance of tic marks in the stream alignment, select the desired length from the dropdown menu.
- By default, tic marks display on the stream alignment. If the user does not want tic marks to display, clear Draw Station Tics. Click Apply, tic marks no longer display in the active map window.
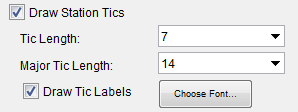
- From the Tic Length list, the user can set the length of the minor tic marks. To change the length of the major tic marks, from the Major Tic Length list, select the length of the major tic marks. For the changes to appear in the active map window, from the Stream Alignment Properties dialog box click Apply, and the map window will update.
- By default, the labels for tic marks appear in the active map window. If the user does not want the labels to display, clear Draw Tic Labels. To change the font of the tic mark labels, click Choose Font, a Font Chooser opens, select the font type from the Type list, and select a size using the Size slider. Click OK, the Font Chooser closes, from the Stream Alignment Properties dialog box, click Apply. Now all of the tic mark labels will appear in the font and size chosen.
Stream Nodes
To change the appearance of all stream nodes in the map window:
- By default stream nodes display, if the user does not want to display stream nodes uncheck the Draw Stream Nodes checkbox, from the Stream Alignment Properties dialog box, and click Apply. The stream nodes no longer display in the active map window.

- The user can select the color of the stream nodes in the stream alignment from the Node Color list. The default color is green, there are several colors to choose from, plus the user has the ability to create colors. From the Node Color list, click Custom, the Choose A Color dialog box will open. The Choose A Color dialog allows the user to select a color using one of the available methods (e.g., from a selection of default color swatches; a hue, saturation, brightness (HSB) model; from a red, green blue and alpha (RGBA) color model).
3. The user can select the color of the outline of stream nodes in the stream alignment from the Node Outline Color list. The default color is dark green, there are several colors to choose from, plus the user has the ability to create colors. From the Node Outline Color list, click Custom, the Choose A Color dialog box will open.
4. The user can set the width of the stream nodes in the stream alignment from the Node Width list.
Stream Junctions
To change the appearance of all stream junctions in the active map window:
- By default the stream junctions display, if the user does not want to display the stream junctions uncheck the Draw Junctions checkbox, from the Stream Alignment Properties dialog box and click Apply. The stream junctions no longer display in the active map window.

- The user can select the color of the stream junctions in the stream alignment from the Junction Color list. The default color is darkgreen, there are several colors to choose from, plus the user has the ability to create colors. From the Junction Color list, click Custom, the Choose A Color dialog box will open.
- The user can set the width of the stream junctions in the stream alignment from the Junction Width dropdown menu.
Scale
Visualization scale can be set for the Stream Alignment map layer:
- To set the visualization scale for the stream alignment to a default, from the Stream Alignment Properties dialog box, from the Scale menu, click Set to Defaults. The visualization scale is set automatically.
- To enter a scale factor, from the Scale menu, click New. The Create New Scale dialog box opens, in the Scale box, enter values for the scale factor.
- Click OK, the Create New Scale dialog box closes, and the visualization scale is set for the stream alignment.

Simulation Layer
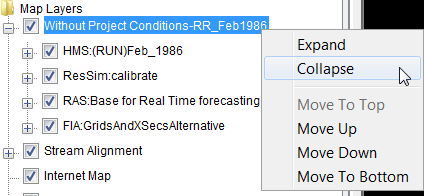
When a simulation map window is open, the Simulation map layer (e.g., Without Project Conditions-RR_Feb1986) for that map window (open and selected in the Desktop Pane) is available. When the Map Layers Tree is expanded for the Simulation map layer (by clicking the plus ![]() sign), the different sub-layers that represent each model in the simulation is displayed. Therefore, if the user did not want to display the impact areas, uncheck the FIA:GridsAndXSecsAlternative sub-layer checkbox. The impact areas will no longer be visible in the simulation map window. To view the impact areas, check the FIA:GridsAndXSecsAlternative sub-layer checkbox. This procedure applies to the Simulation map layer and all of the sub-layers of the simulation map layer.
sign), the different sub-layers that represent each model in the simulation is displayed. Therefore, if the user did not want to display the impact areas, uncheck the FIA:GridsAndXSecsAlternative sub-layer checkbox. The impact areas will no longer be visible in the simulation map window. To view the impact areas, check the FIA:GridsAndXSecsAlternative sub-layer checkbox. This procedure applies to the Simulation map layer and all of the sub-layers of the simulation map layer.
Simulation Shortcut Menu
The shortcut menu for the Simulation map layer is accessed by right-clicking on the simulation layer (i.e., Without Project Conditions-RR_Feb1986) in the Maps tab. The shortcut menu provides several ways to manipulate the Simulation map layer. The available commands are:
Expand – expands the Simulation map layer's tree; the tree provides information on the available elements of the simulation.
Collapse – collapses the Simulation map layer's tree; the tree provides information on the available elements of the simulation.
Move to Top – moves the Simulation map layer to the top of the tree
Move Up – moves the Simulation map layer up the tree one position
Move Down – moves the Simulation map layer down the tree one position
Move to Bottom – the Simulation map layer to the bottom of the tree
Schematic Layer
When a schematic map window is open, the Schematic map layer for that map window (selected in the Desktop Pane) is available. In the figure below, the Schematic map layer is Without Project Conditions. The Schematic map layer contains the graphical representations of the measures, common computation points, and impact areas. When the tree expands, the different sub-layers that represent each element are displayed. Therefore, if the user did not want to the impact areas displayed in the schematic map window, clear Impact Areas. The impact areas will no longer display in the schematic map window. To view the impact areas, click Impact Areas. This procedure applies to all of the sub-layers of the schematic layer.

Schematic Shortcut Menu
The shortcut menu for the Schematic map layer is accessed by right-clicking on the schematic layer (i.e., Without Project Conditions) in the Maps tab. The shortcut menu provides several ways to manipulate the Schematic map layer. The available commands are:
- Expand – expands the Schematic map layer's tree; the tree provides information on the available elements of the schematic.
- Collapse – collapses the Schematic map layer's tree; the tree provides information on the available elements of the schematic.
- Move to Top – moves the Schematic map layer to the top of the tree.
- Move Up – moves the Schematic map layer up the tree one position.
- Move Down – moves the Schematic map layer down the tree one position.
- Move to Bottom – the Schematic map layer to the bottom of the tree.
- Properties – opens the Drawing Properties Editor (which is discussed in greater detail in the next section). This editor allows the user to edit properties of the elements and measures that are part of the Schematic map layer.
- Export Schematic – opens the Export Schematic Layers dialog box which allows the user to export the selected elements for the active Schematic Layer to shapefiles.

Adjust the Schematic Properties
For the Schematic map layer, the user can configure the appearance of the measures, common computation points, and impact areas.
To configure:
- From the Maps tab, from the Map Layers Tree, right-click on a Schematic map layer. From the shortcut menu, click Properties, and the Drawing Properties Editor will open. The Drawing Properties Editor is divided into the Reservoir, Levees, Diversions, Channel Modification, Computation Point, and Impact Area tabs, which represent the elements and measures in the study schematic.
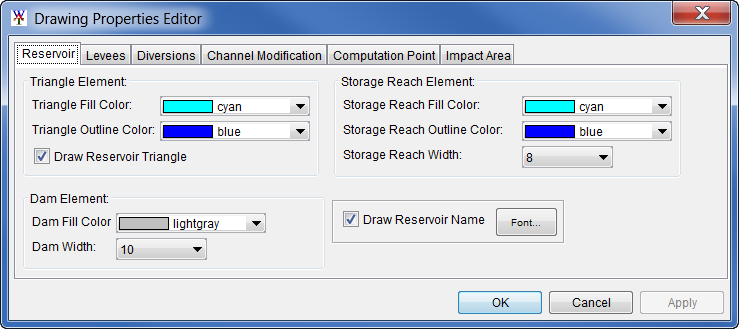
- Depending on the element (i.e., reservoirs, levees, etc.), the user can change the color of the element, the size of the element, whether the element is drawn or not, whether the label of the element is drawn or not, and what font and size of font the label of the element is displayed in.
- For example, from the Reservoir tab the user can set the width and colors of the different elements that make up a reservoir, whether to draw the reservoir polygon (triangle), whether to draw the reservoir label, and set the font for the reservoir label. The Triangle Fill Color, Triangle Outline Color, and Draw Reservoir Triangle affect the polygon (triangle) of a reservoir. The Storage Reach Fill Color, Storage Reach Outline Color, and Storage Reach Width affect the storage reach of a reservoir. The Dam Fill Color and the Dam Width affect the dam of a reservoir.
- By default, the labels for the reservoirs appear in the display area. If the user does not want to display the labels, clear Draw Reservoir Name; click Apply, and the reservoir labels no longer appear in the display area. To change the font of the reservoir labels, click Font. A Font Chooser opens, select the font type from the Type list, and either select a size from the Size slider or enter a size.
- Click OK, the Font Chooser closes, from the Drawing Properties Editor, click Apply. Now all of the reservoir labels will display in the font and size chosen. The other elements in the Drawing Properties Editor have similar properties.