Task 3: Compute the No Future Rain Forecast Run
For this task, you will compute the No Future Rain Forecast Run and analyze the results.
Compute the Forecast
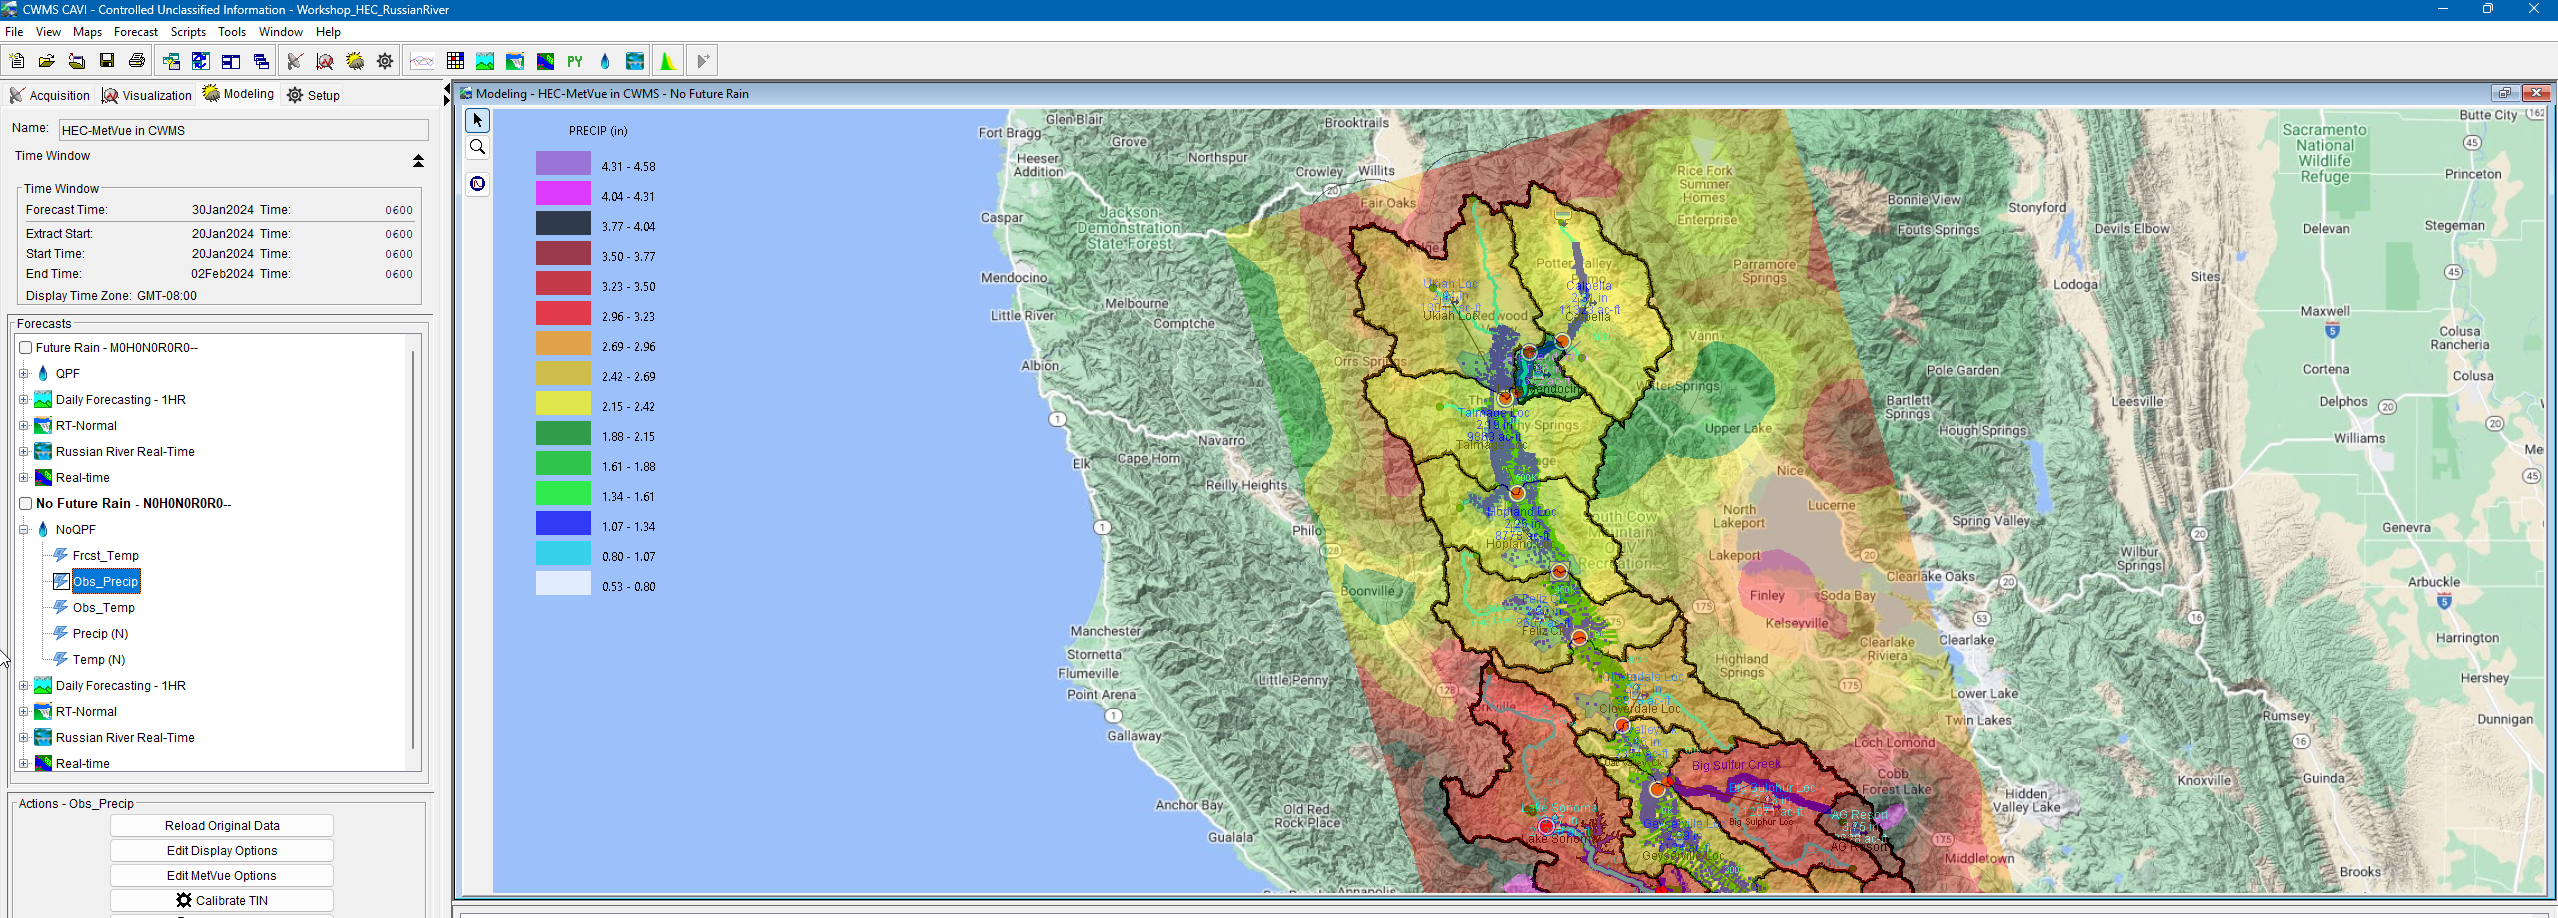
- Set the No Future Rain CAVI Forecast Run to display in the existing CAVI map window, then compute the forecast run and review the results.
- Expand the HEC-MetVue NoQPF model alternative tree. Clicking on each HEC-MetVue Map node will display the basin averages for each dataset.

If the basin average layer does not display immediately after clicking on a particular MetVue Map node in the Forecasts tree, use slight panning or zooming in the map window to refresh the display.
What is the range of total observed precipitation (Obs_Precip) across the Russian River? How did you determine this?
The basin averages are mostly in the range of 2-3 inches in total over the 10-day time window, except for the headwater of Lake Sonoma where the basin average total is around 4 inches for the 10-day time window.
The total range of observed precipitation can be determined by opening the MetVue application directly, or by inspecting the subbasin average precipitation directly from the CAVI.
For the Precipitation (N) results map, notice that the range of total precipitation for the entire 13-day simulation time window is exactly the same as the range for the Obs_Precip for the 10-day observed time window, why is that?
Since there is no forecast dataset is included in this NoQPF model alternative, HEC-MetVue uses a default of zero forecast precipitation. Therefore the basin average totals for the entire simulation will equal the observed precipitation totals.
What is the range of average observed temperature (Obs_Temp) across the Russian River?
The basin averages are in the range of 50-60 degrees Fahrenheit average across the entire basin.
Review the Results
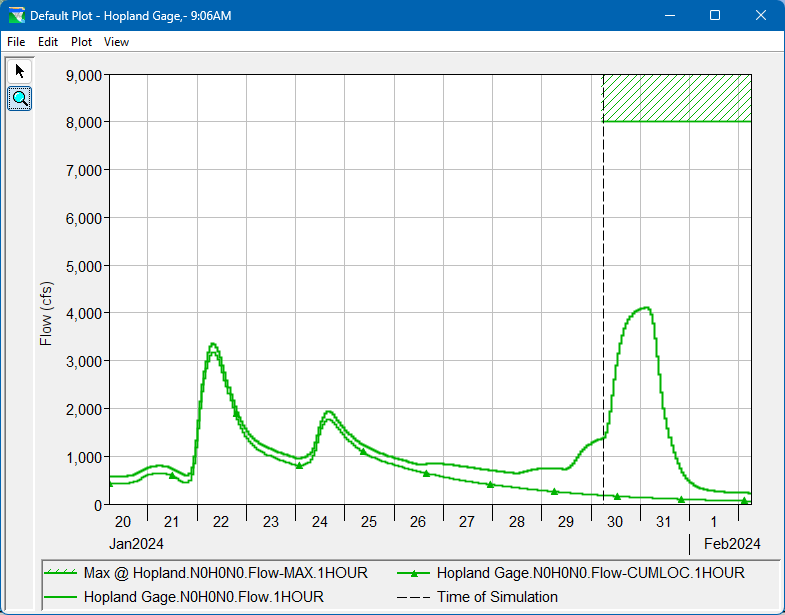
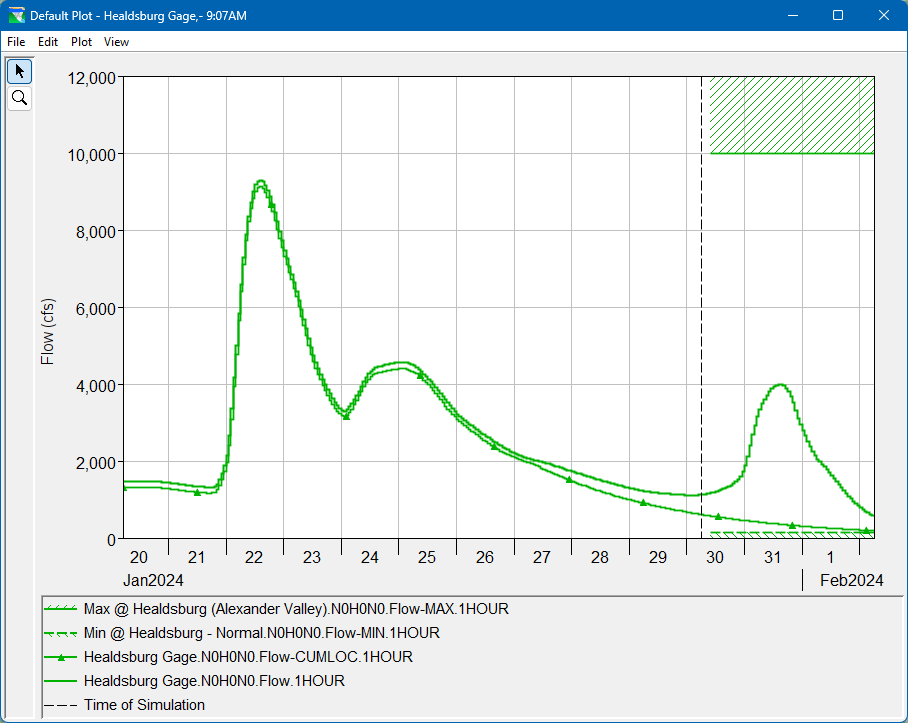
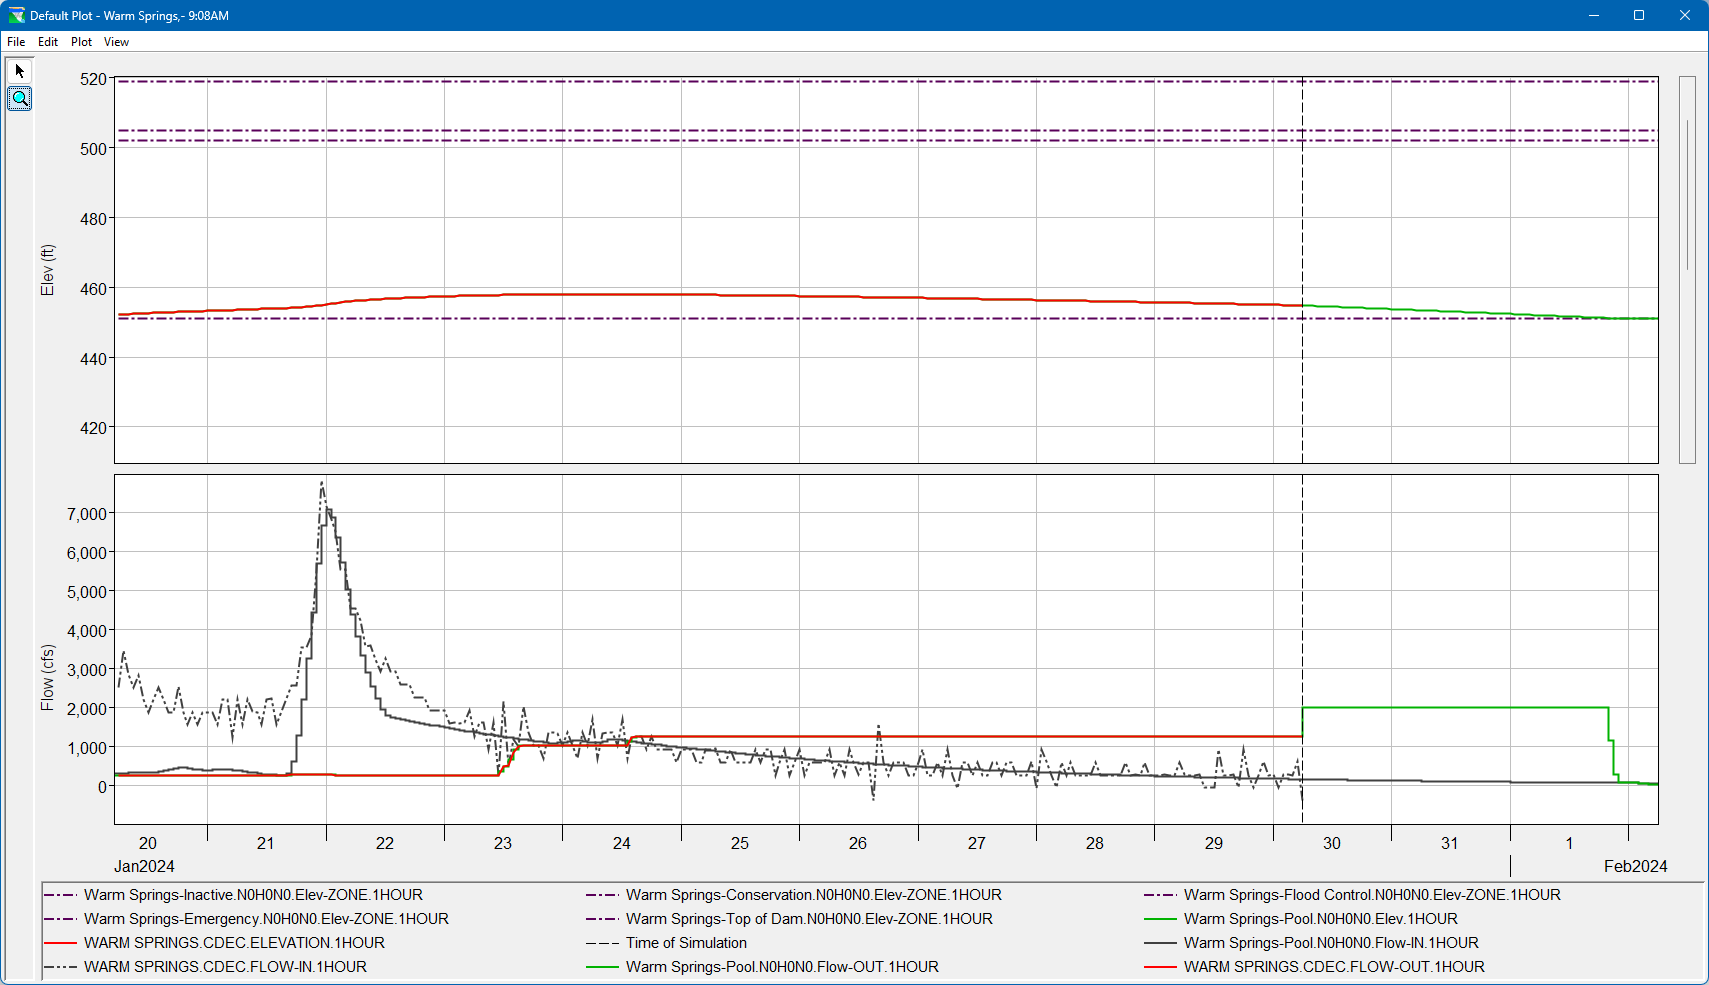
- From the Map Window, open and review the HEC-ResSim plots for the reservoirs and key operating points:
- Coyote Dam/Lake Mendocino
- Hopland
- Healdsburg
- Warm Springs Dam/Lake Sonoma
- Dry Creek Confluence
- Hacienda Bridge Gage above Guerneville
NOTE: Ensure that the Rain-on-the-ground forecast alternative is the only one bolded and checked within the Forecast tree.
Coyote Dam/Lake Mendocino

Hopland

Healdsburg

Warm Springs Dam/Lake Sonoma

Dry Creek Confluence

Hacienda Bridge Gage above Guerneville

Assuming no future rain, how do the results of this scenario look at the reservoirs and operating points?
The reservoir inflow and local flows are receding everywhere, allowing both reservoirs to make necessary releases to get to their guide curves. Downstream flows are well within the maximum operating limits at the key operating points.