Task 4: Compute the QPF Forecast Run
In this part, you will compute the Future Rain forecast run, analyze the results, and compare them against the results from the NoQPF scenario.
Run the QPF Forecast
- Select the forecast run Future Rain and display it in the existing CAVI map window.
- Compute the forecast run and review the results.
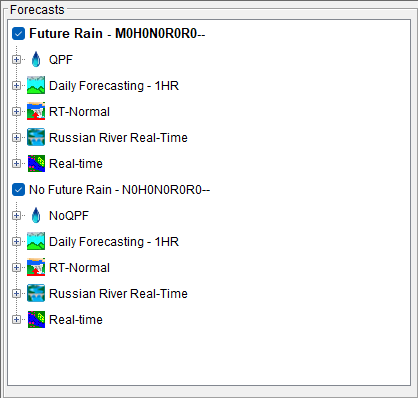
- Expand the HEC-MetVue QPF model alternative tree.

- Clicking on each HEC-MetVue Map node (Frcst_Precip, Obs_Precip etc.) will display the basin averages in the map for each dataset.
Note: if the data does not display, first verify that it is selected to "display in map", then zoom in and out one step.
- Expand the HEC-MetVue QPF model alternative tree.
What is the range of total forecast precipitation (Frcst_Precip) across the Russian River?
In the central watershed, the averages are mostly in the range of 4-5 inches in total over the 3-day forecast time window. Lower totals (3-4 inches) are forecasted for the northern and southern portions of the watershed.
For the Precipitation (M) results map, what is the range of total precipitation for the entire 6-day simulation time window?
Given a 10-day observed (Obs_Precip) total is between 2-3 inches across the Russian River watershed, and the 3-Day forecast (Frcst_Precip) total is between 4-5 inches, the total in the combined Precip (M) dataset is between 6-8 inches.
Review and Compare the Results
- Open the HEC-ResSim plots for the reservoirs and key operating points from the CAVI map window.
- Coyote Dam/Lake Mendocino
- Hopland
- Healdsburg
- Warm Springs Dam/Lake Sonoma
- Dry Creek Confluence
- Hacienda Bridge Gage above Guerneville
To compare the HEC-ResSim results from the QPF and NoQPF scenarios, keep the Future Rain forecast displayed in the CAVI map window and check the view results box next to the No Future Rain scenario. In doing so, the CAVI map window will display the HEC-ResSim results for both scenarios in the same plot for any location in the model.
Coyote Dam/Lake Mendocino

Hopland

Healdsburg

Warm Springs Dam/Lake Sonoma

Dry Creek Confluence

Hacienda Bridge Gage above Guerneville

How do the results compare between the two different scenarios at the reservoirs and operating points?
Unlike the NoQPF scenario, the forecasted inflows into both reservoirs for the QPF scenario are significant and push both pools higher in their respective flood zones.
Additionally, with between 3-5 inches of precip in the 3-day forecast over the Russian River watershed, the uncontrolled downstream inflows naturally exceed the maximum operating limit for downstream operating points (Healdsburg and Hopland). That forces both reservoirs to curtail their releases to the minimum to avoid compounding the downstream flooding.