Task 5: Adjust the QPF Scenario
In this part, you will continue working with the Future Rain forecast run and increase the QPF above Coyote Dam, compute the adjusted QPF forecast run, and analyze the results and compare against the NoQPF scenario.
Adjust the Frcst_Precip using HEC-MetVue Standalone
- Open HEC-MetVue from the CAVI Tool Bar icon.
When working with the full HEC-MetVue interface, minimize the CAVI window to avoid continuous map display syncing that can occur when both HEC-MetVue and the CAVI are open in the same computer screen.
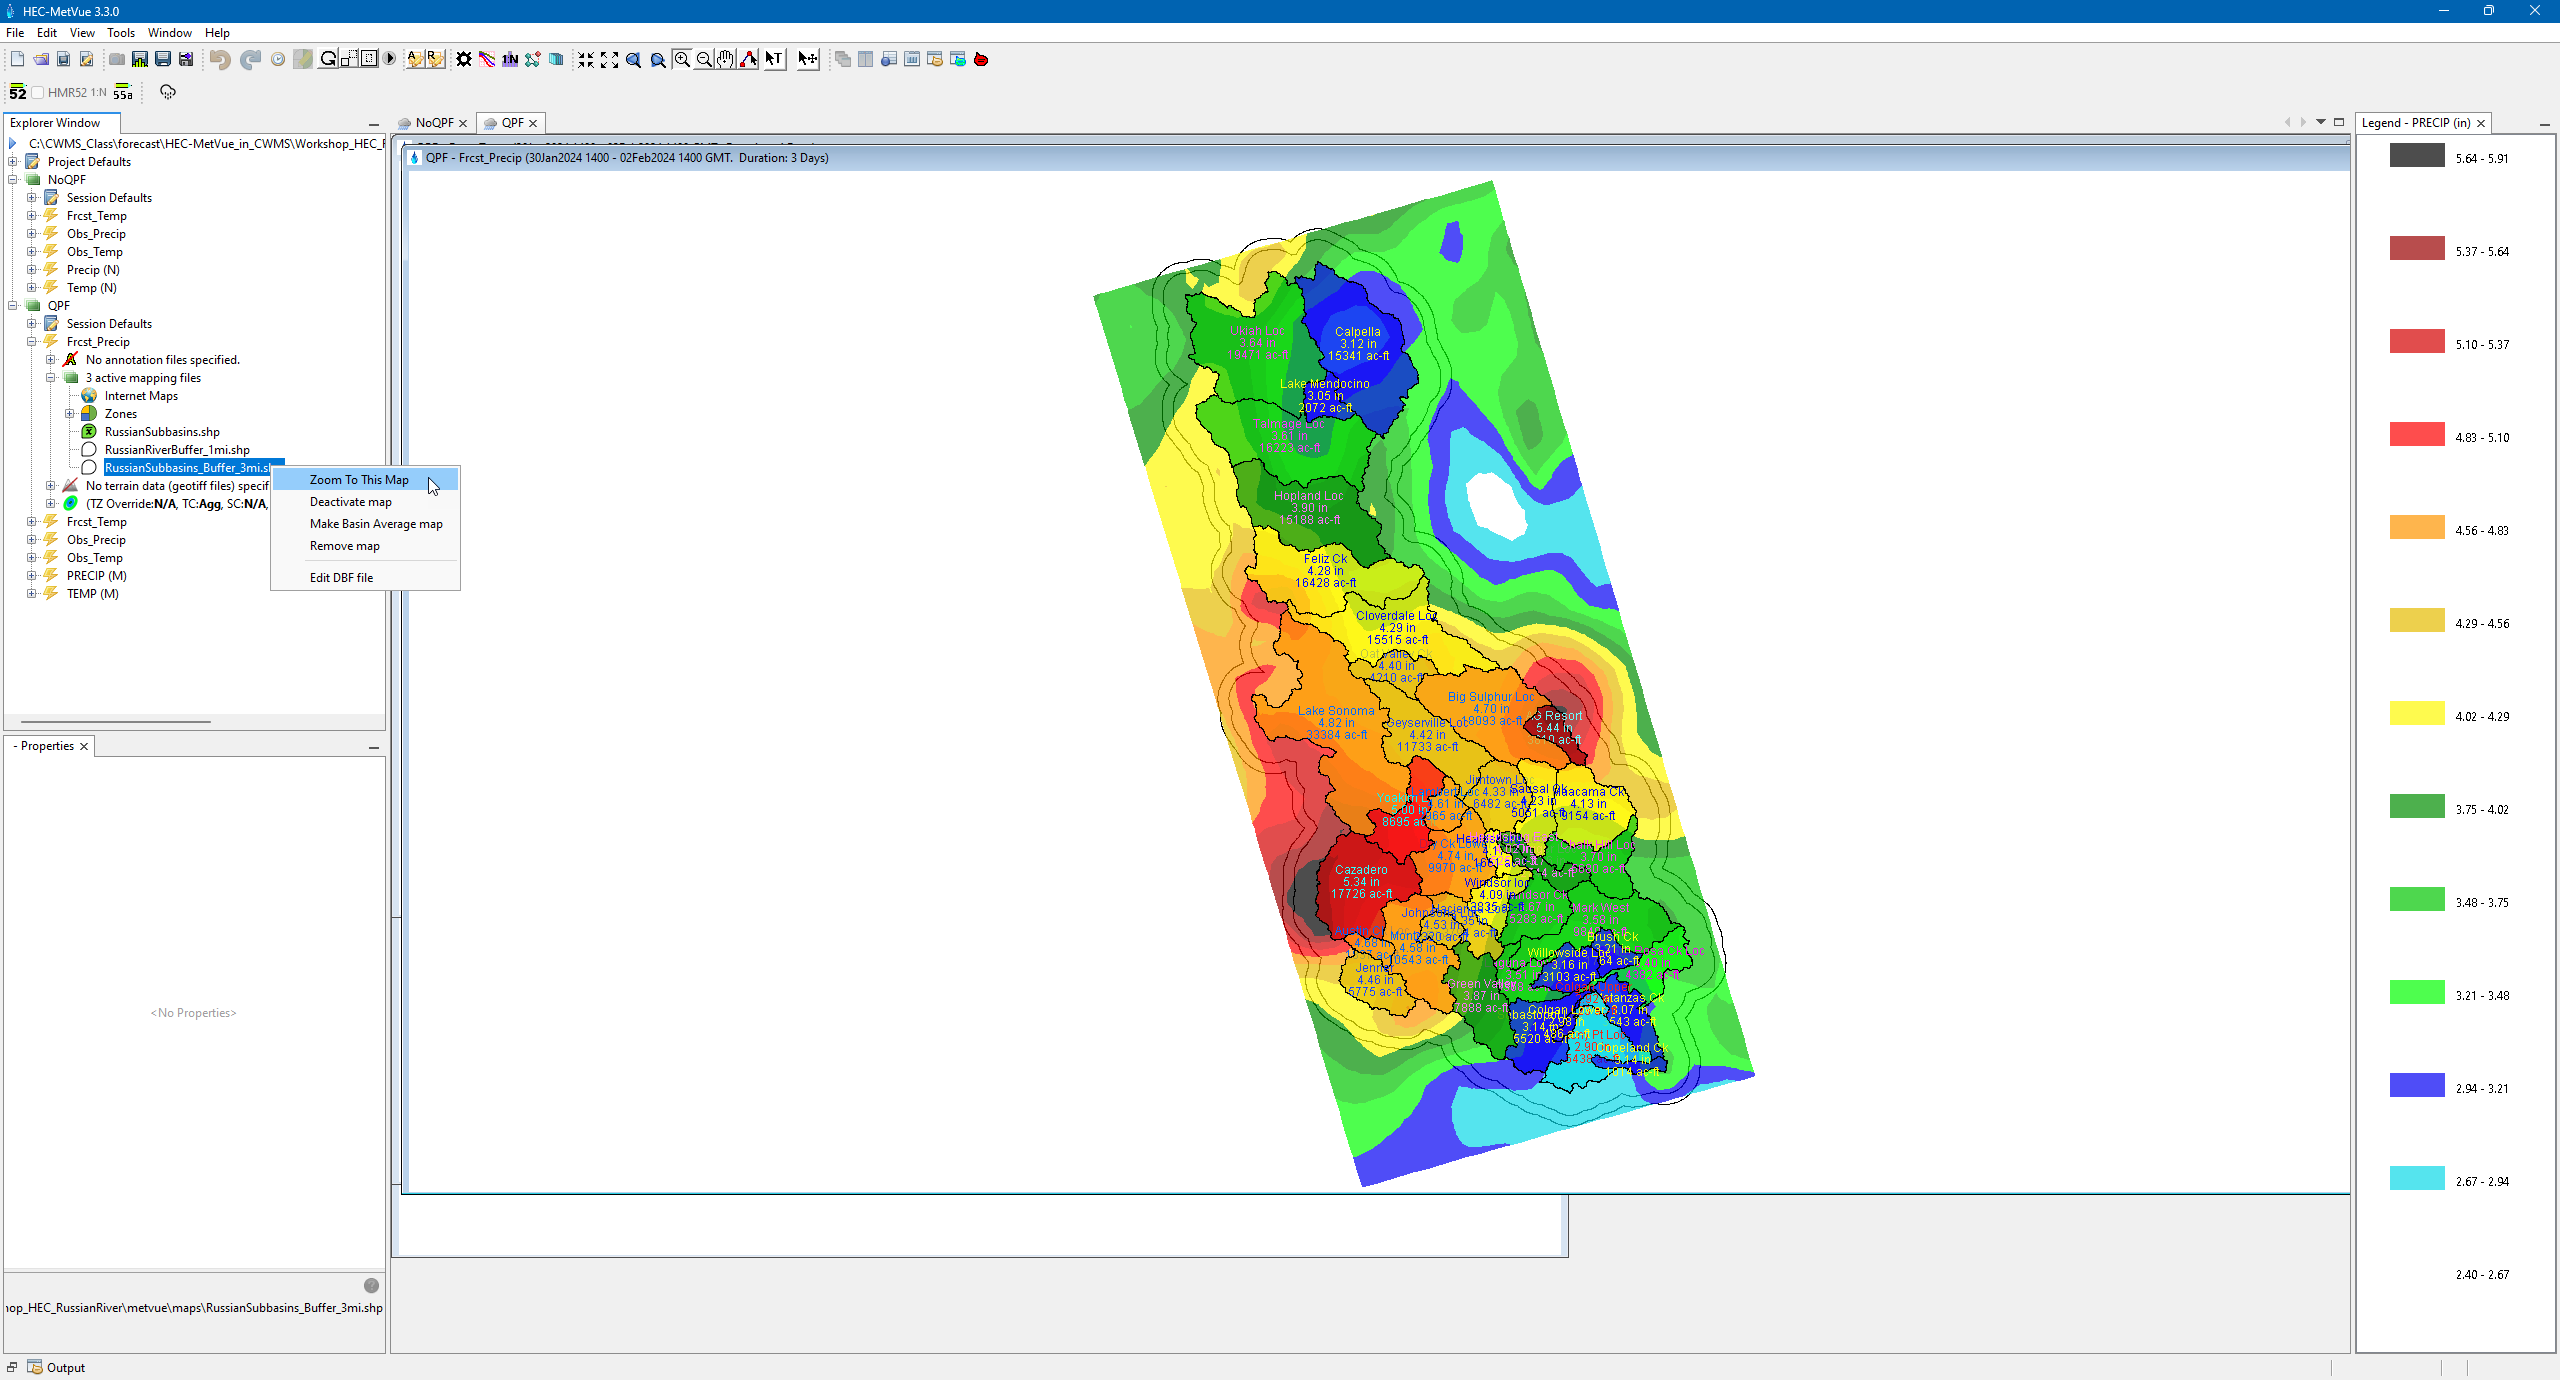
- From HEC-MetVue’s QPF session, select the Frcst_Precip Map Window. Expand the active mapping files and right click the RussainSubbasins_Buffer_3mi.shp. Select Zoom to this Map.
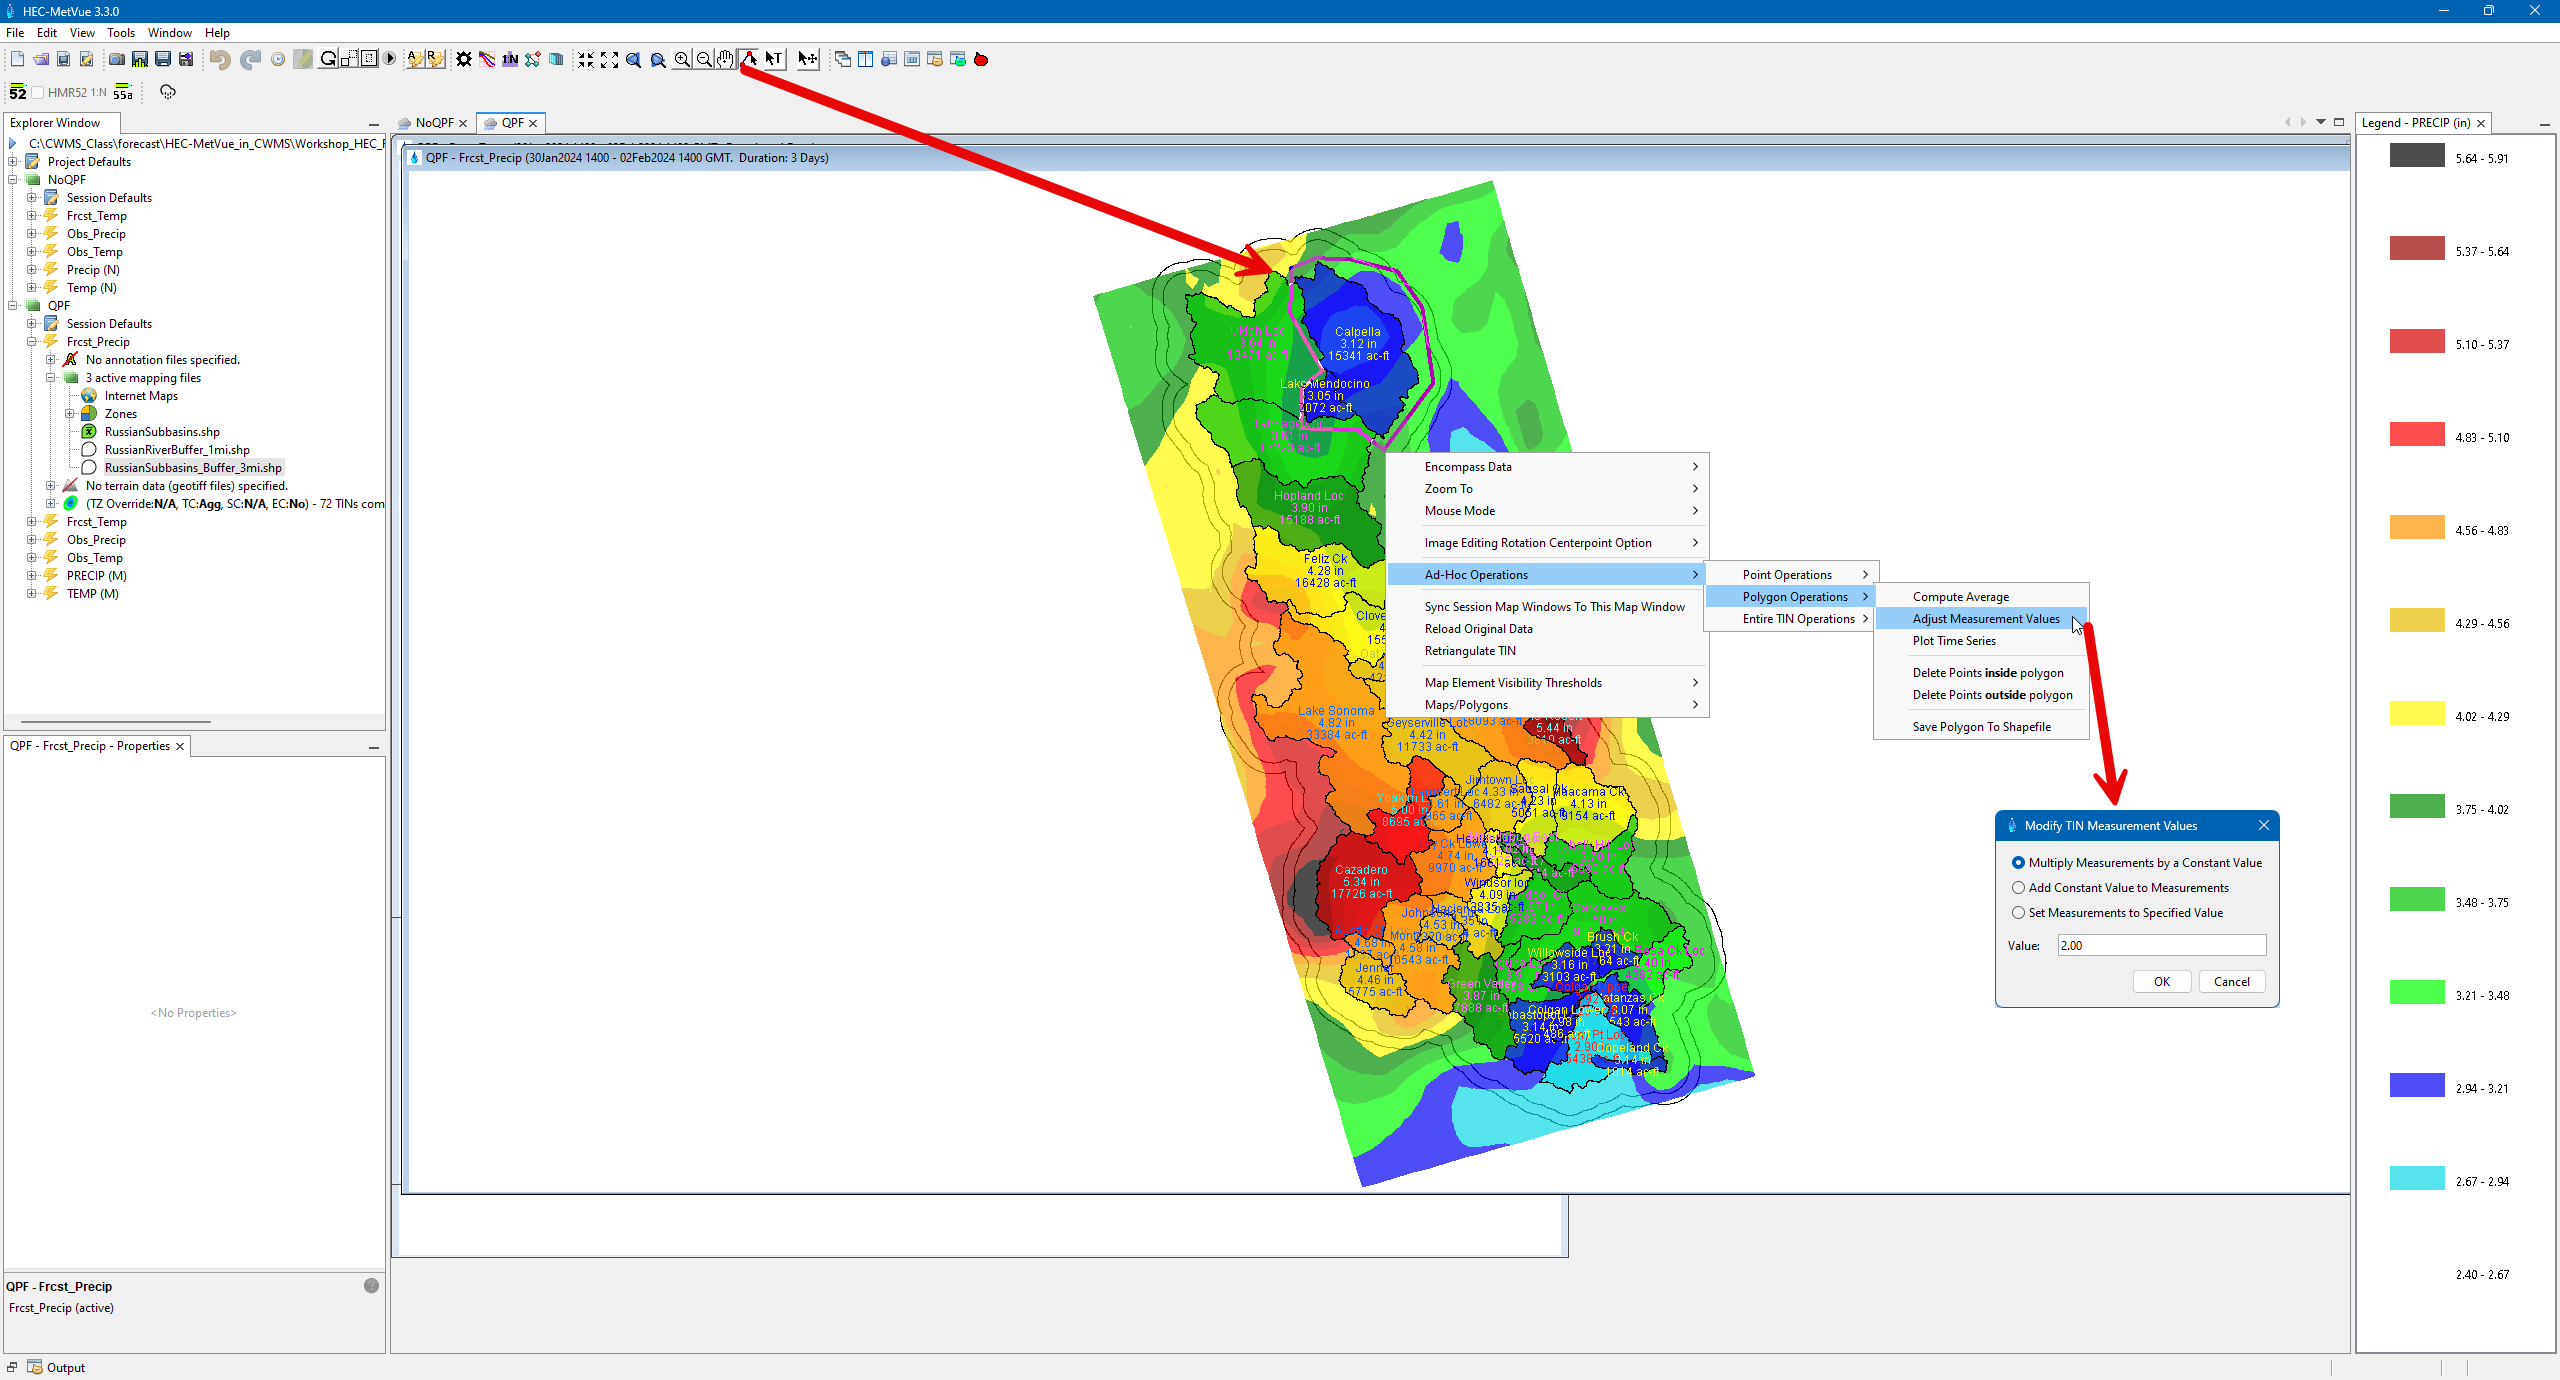
- Select the polygon drawing tool and draw a polygon around Coyote Dam’s headwater subbasin Calpella.
- Right-click on the polygon. From the Ad-Hoc Polygon Operations menu, select the Adjust Measurement Values option and set a multiplier of 2.
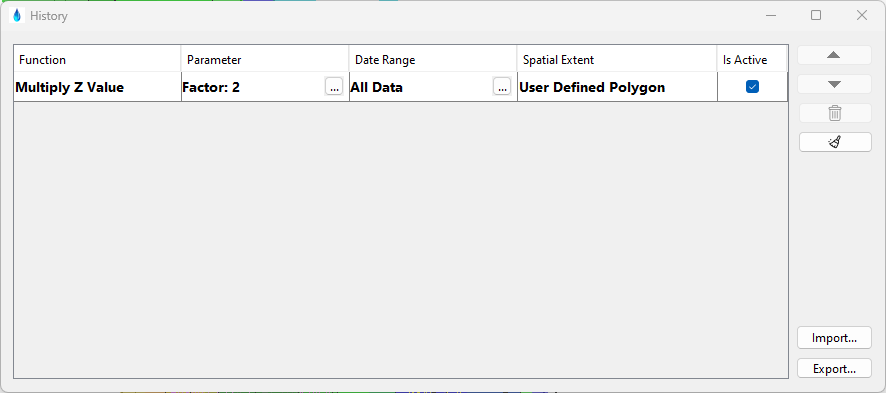
- After confirming the modification, a history of MetVue edits will appear. This feature (new as of MetVue 3.4 allows you to track changes and reapply/activate previous changes). Close the History Window to return to MetVue. Notice in the History Window, there are buttons for Import and Export. This feature allows the user to either export modifications to other MetVue Alternatives or import modifications from other alternatives.
What is the resulting Frcst_Precip basin average total precipitation for the Calpella subbasin after the QPF values were modified?
Calpella’s basin average total for the 3-day forecast period increased from ~3 inches to ~6 inches.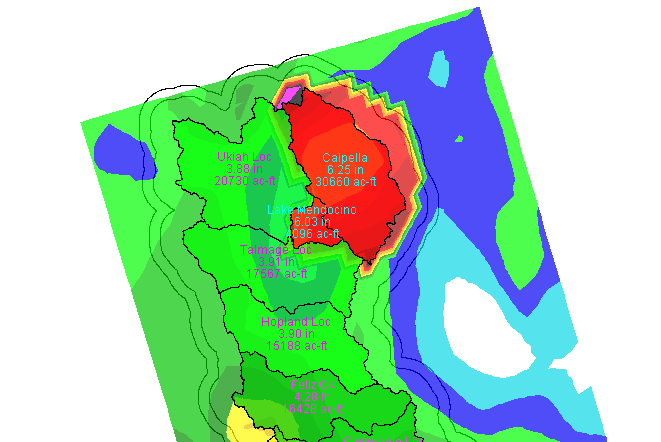
Save the HEC-MetVue project, close the HEC-MetVue window, and return to the CAVI.
Compute the Modified QPF Scenario
- Compute the Future Rain CAVI forecast run with the adjusted QPF above Coyote Dam.
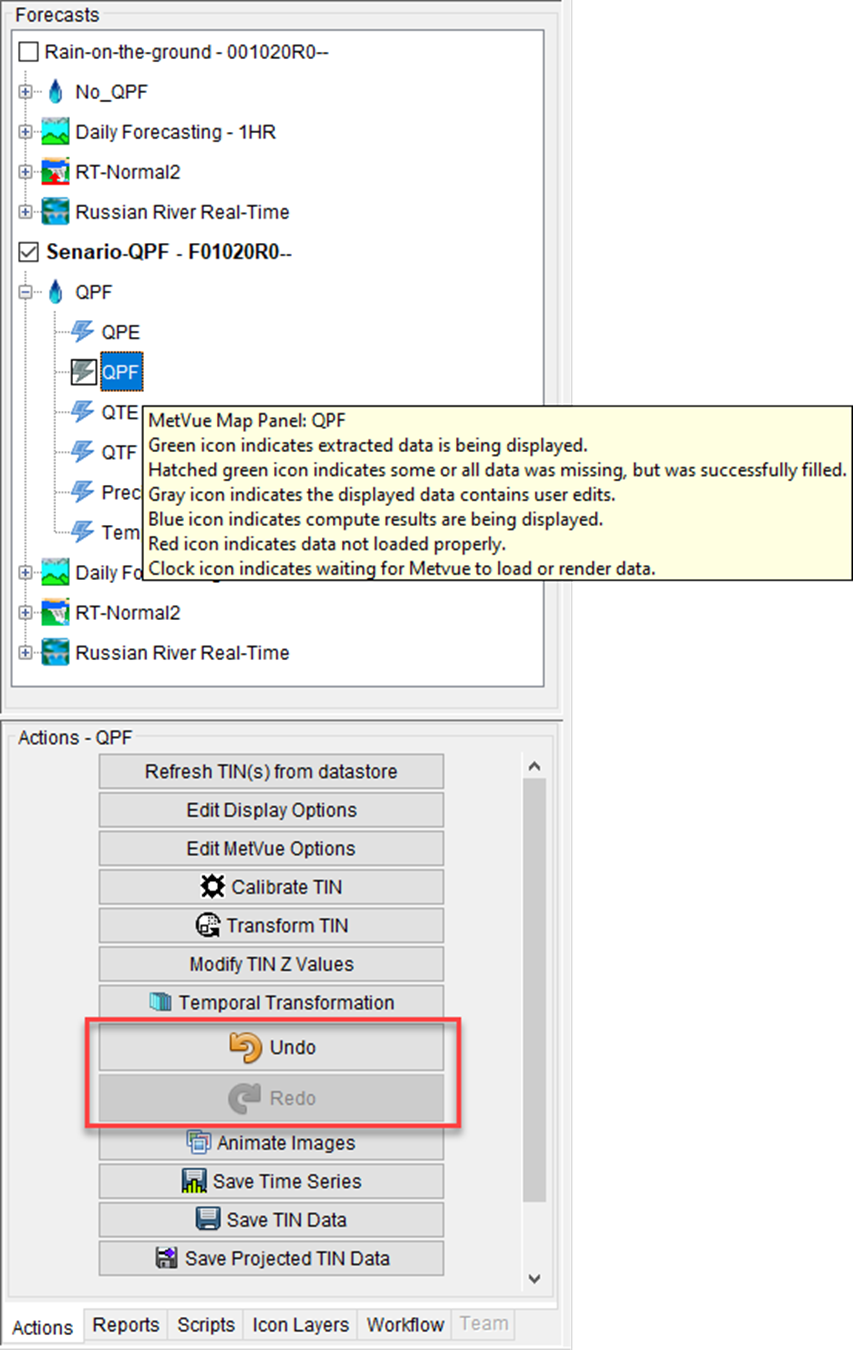
HEC-MetVue has an Undo/Redo feature. To revert back to the unadjusted QPF, use the HEC-MetVue Undo button and recompute the CAVI forecast run. To reapply the adjustment, use the HEC-MetVue Redo button and recompute the CAVI forecast run.
Review the Results
- From the Map Window, open and review the HEC-ResSim plots for the reservoirs and key operating points:
- Coyote Dam/Lake Mendocino
- Hopland
- Healdsburg
- Warm Springs Dam/Lake Sonoma
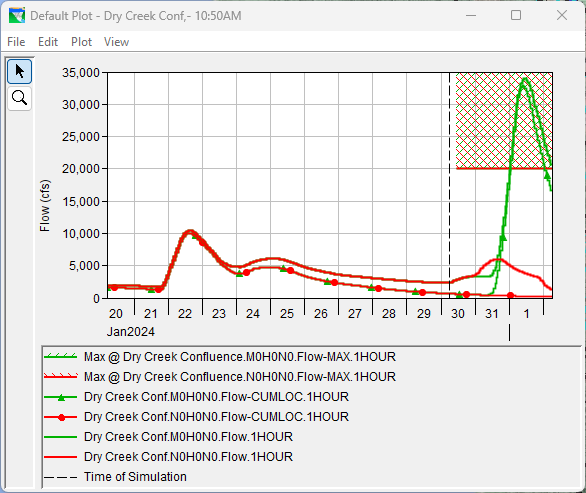
- Dry Creek Confluence
- Hacienda Bridge Gage above Guerneville
Coyote Dam/Lake Mendocino
Hopland

Healdsburg
Warm Springs Dam/Lake Sonoma
Dry Creek Confluence
Hacienda Bridge Gage above Guerneville
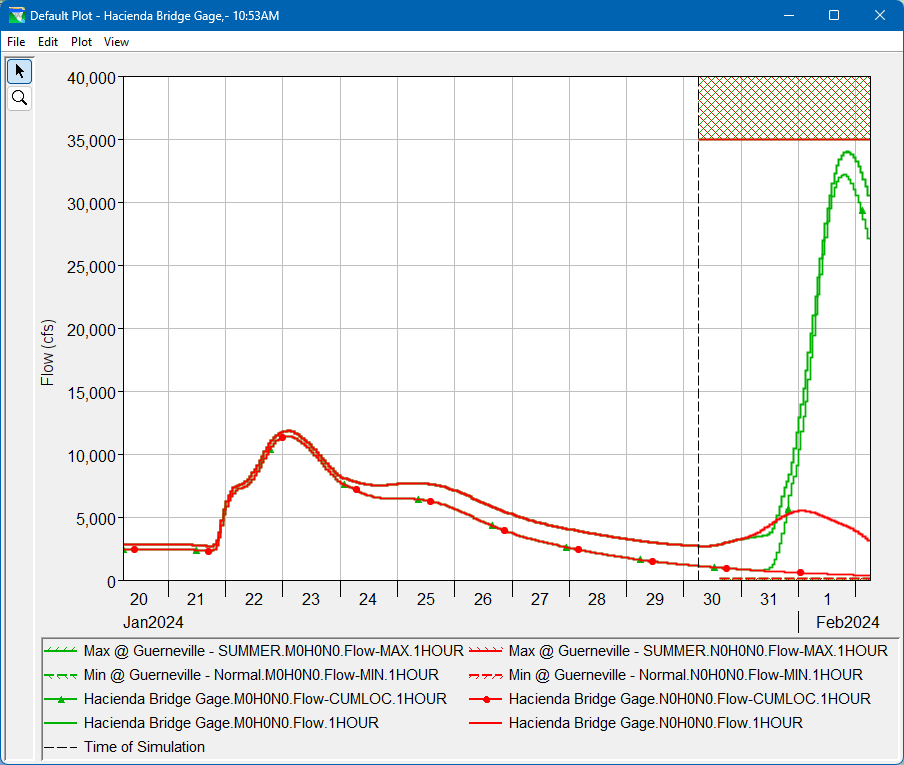
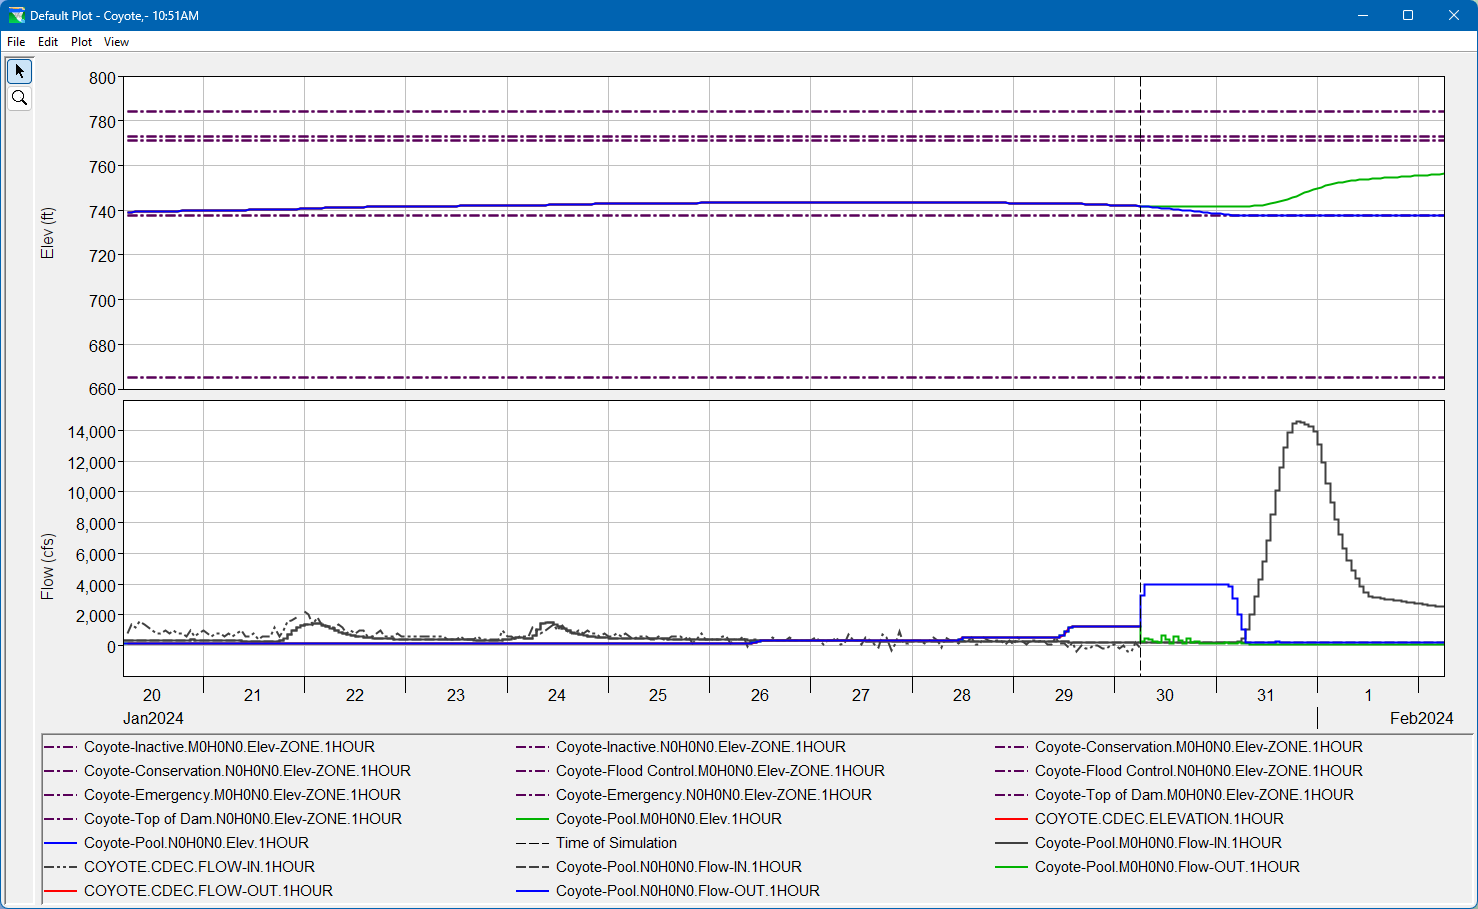
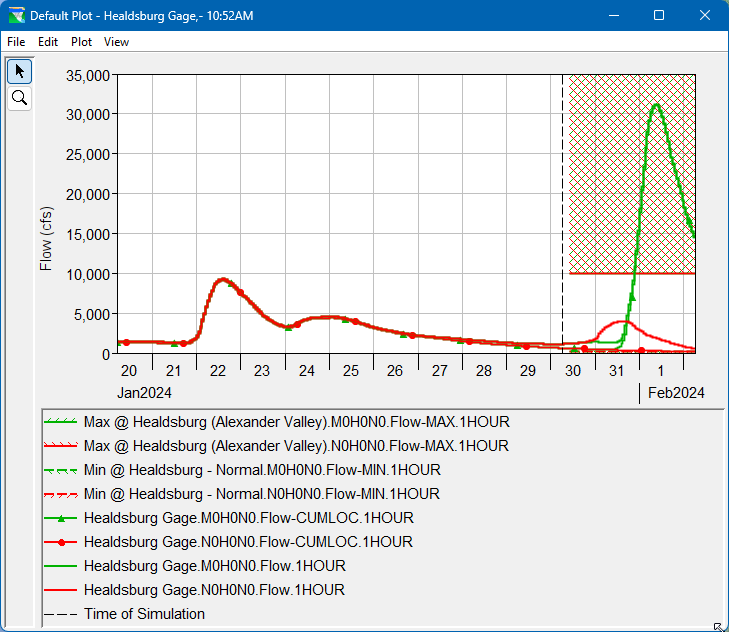
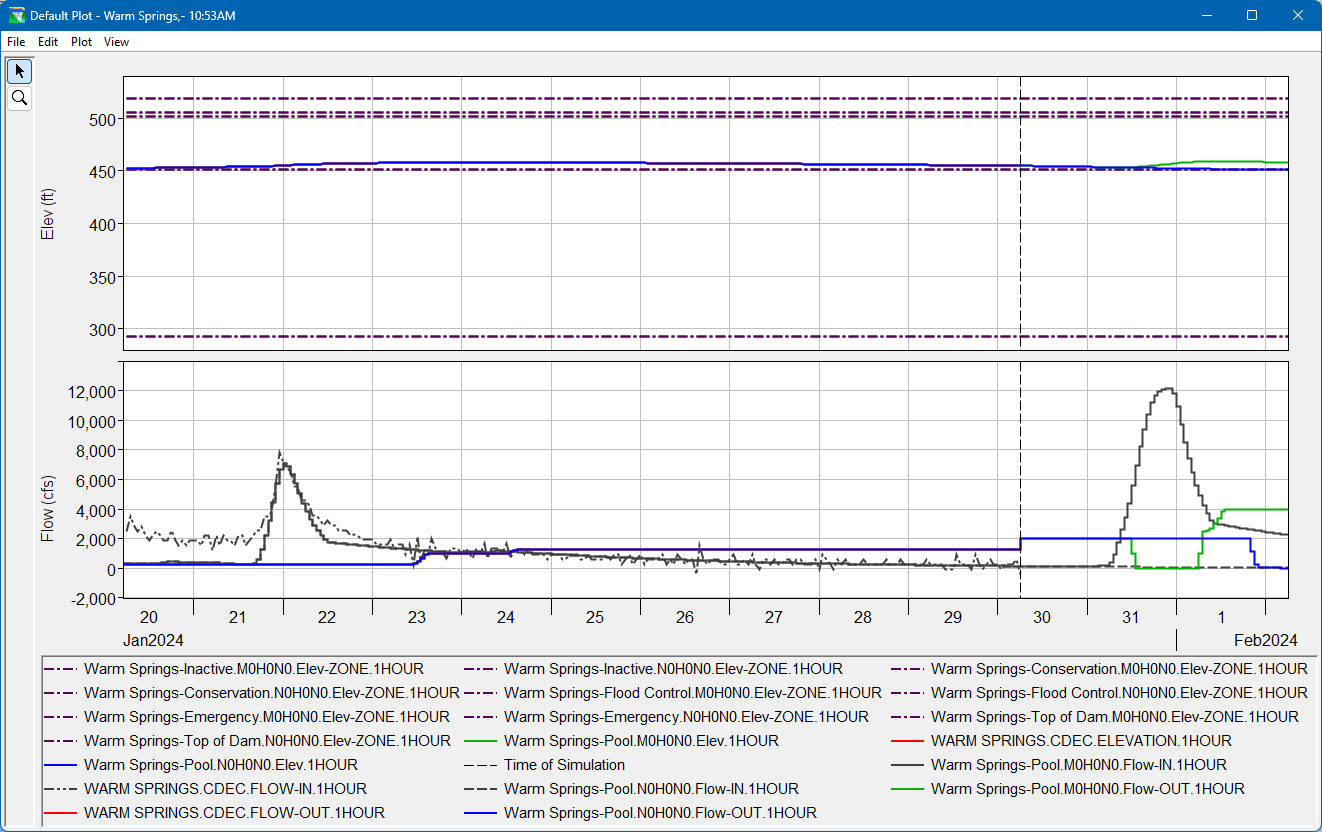
How do the results compare between the adjusted QPF scenario and the No_QPF scenario at the reservoirs and operating points?
The doubling of the QPF above Coyote Dam only affected the reservoir’s inflow, quite significantly increasing the flood pool encroachment. However, there were no significant changes at the downstream operating points.