Download PDF
Download page v.4.9.0 Release Notes.
v.4.9.0 Release Notes
Beta release:
Final release:
New Features
Multiple Element Merge
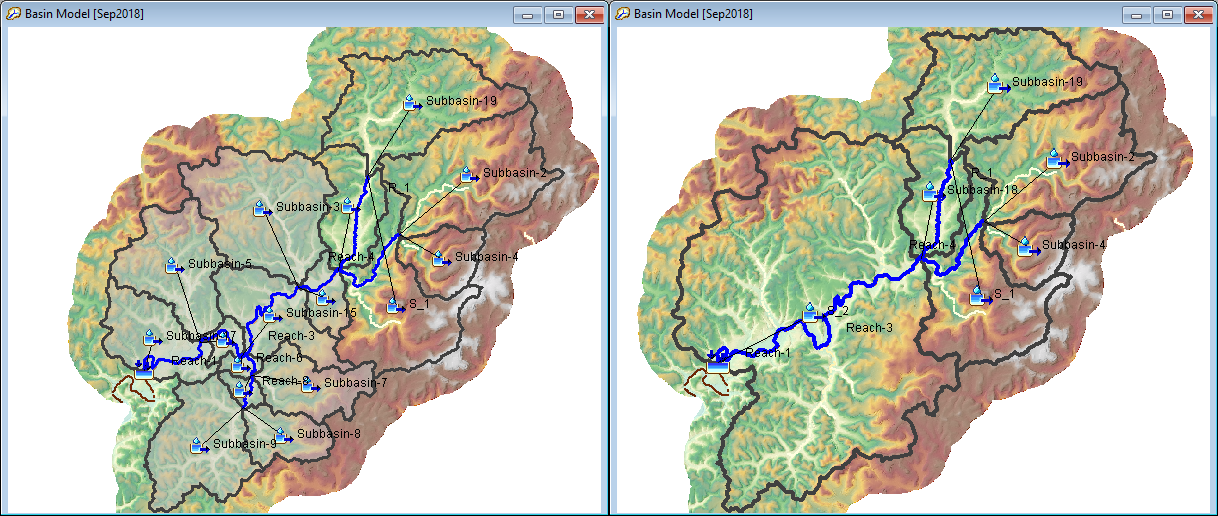
In previous versions of HEC-HMS, merging elements was limited to two elements at a time. The merge logic has been re-written so that the number of elements that can be merged is unrestricted. To be eligible for merge, the elements must be of the same type and contiguous in hydrologic order. In the images below, the image on the left shows multiple elements selected for merge. The image on the right shows the resultant delineation after merging.
This feature was implemented as a part of ongoing GIS work. Funding sources include the Corps Water Management System (CWMS) National Implementation Program. Initial code implementation and documentation were done by Thomas Brauer. Testing was done by Thomas Brauer, Matt Fleming, and Mike Bartles.
Enhanced Element Split
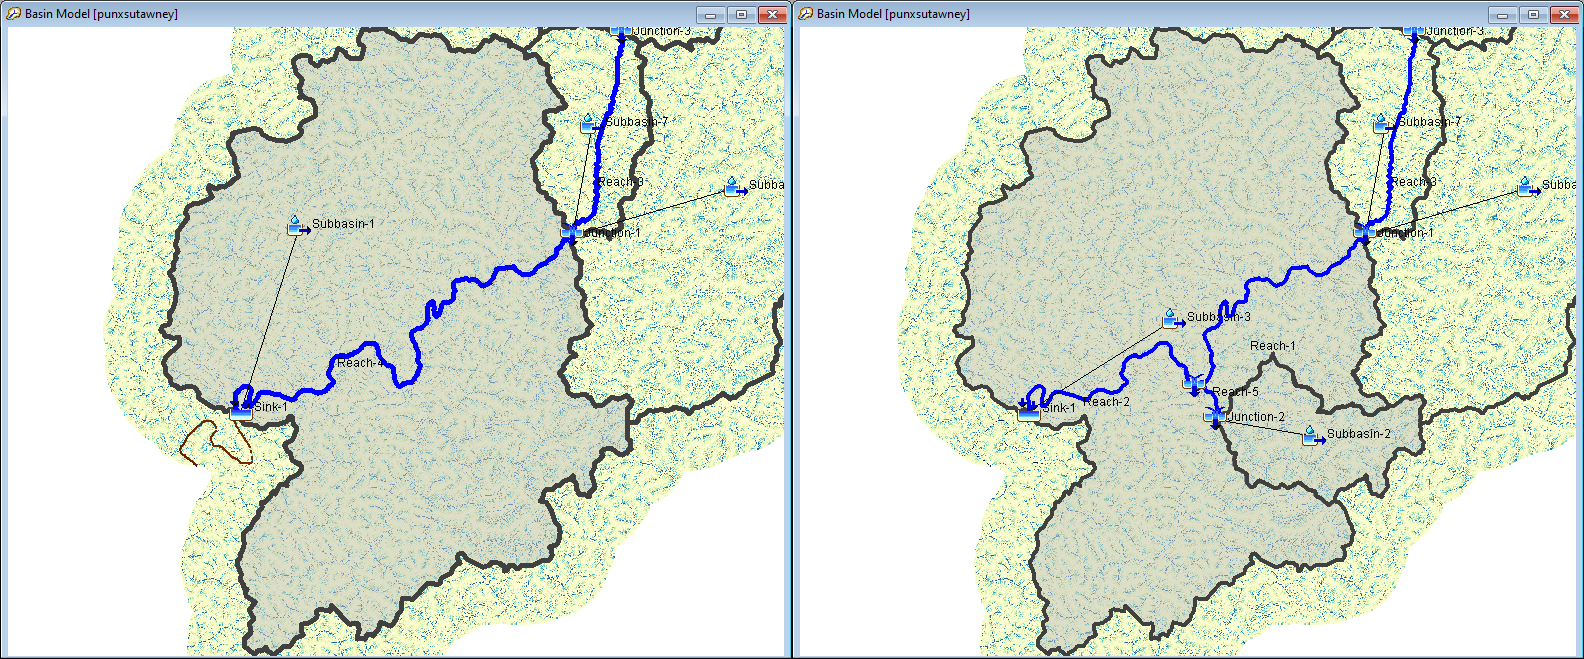
In previous versions of HEC-HMS, splitting elements was limited to locations that coincided with the identified streams layer. The element split logic was been re-written to be more robust, more performant, and allow subbasin element splitting from any location within the selected subbasin.
If the selected element is a headwater subbasin, a reach will be created that connects the upper subbasin to the outlet.
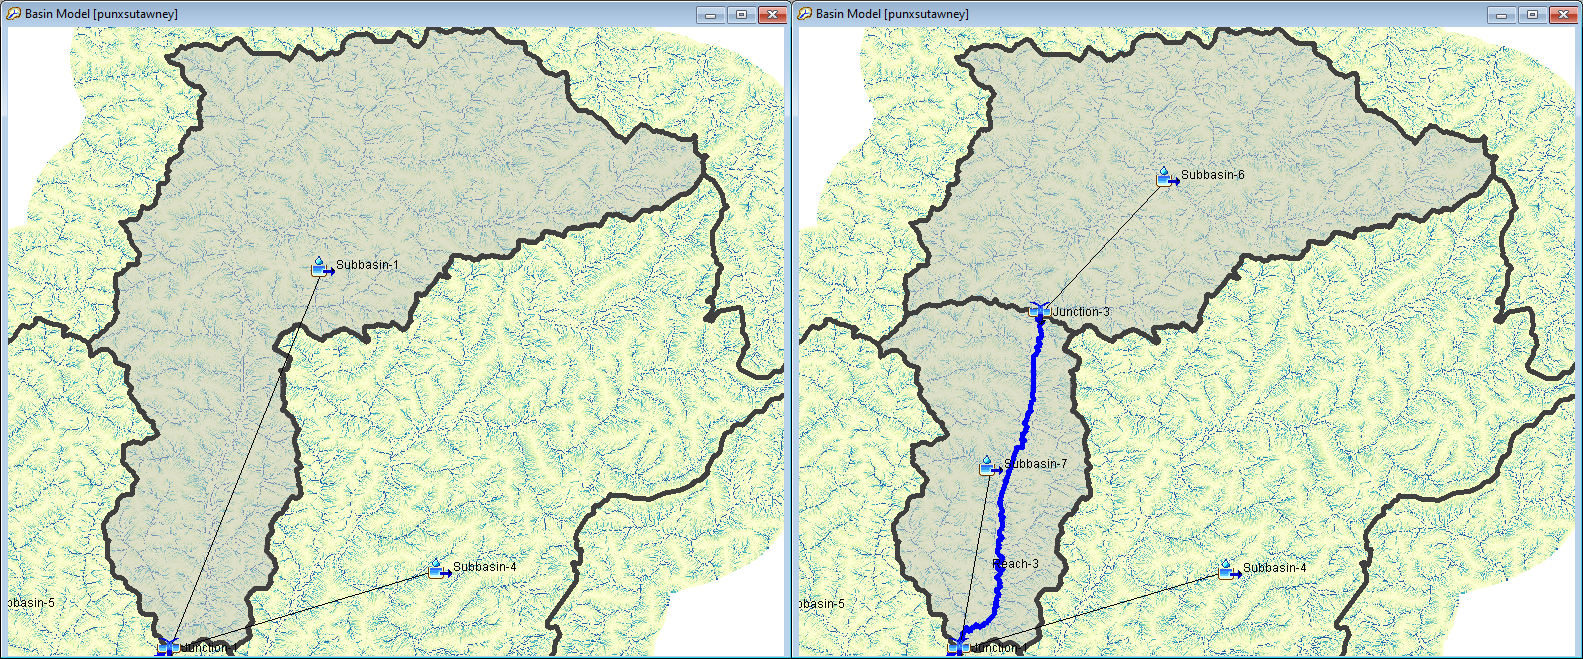
If the selected element is an intermediary subbasin, a reach will be created that connects the upper subbasin to the existing stream network.
This feature was also implemented as a part of ongoing GIS work. Funding sources include the CWMS National Implementation Program. Initial code implementation and documentation were done by Thomas Brauer. Testing was done by Thomas Brauer, Matt Fleming, and Mike Bartles.
Basin Reproject
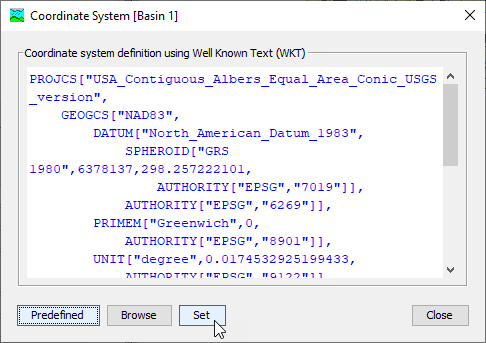
In previous versions of HEC-HMS, the basin model coordinate system could not be changed once initialized. In this version, the basin model coordinate system can now be changed in the Coordinate System Dialog, accessed from the GIS | Coordinate System menu. When a new coordinate system is set for the basin model, all GIS files associated with the basin model are reprojected and the basin map is re-rendered.
This feature was also implemented as a part of ongoing GIS work. Funding sources include the CWMS National Implementation Program. Initial code implementation and documentation were done by Thomas Brauer. Testing was done by David Ho.
Automated Forecast
An automated forecast option has been added that automatically pulls data from the web, and generates a continuous forecast with look back period data and forecast period data. The automated forecast option is built to be extensible but currently only references data sources for the Continental United States. To run the automated forecast, you must have basin model with spatial elements (georeferenced subbasin elements). Subbasin elements should use a structured or unstructured discretization. The basin model should also be configured for continuous simulation.
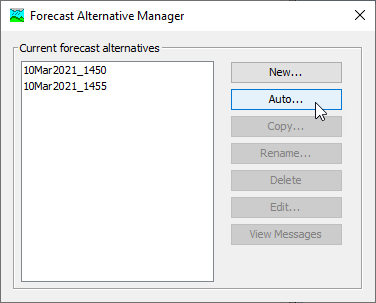
The automated forecast option is available in the Forecast Alternative Manager shown below. The Forecast Alternative Manager can be accessed from Compute | Forecast Alternative Manager.
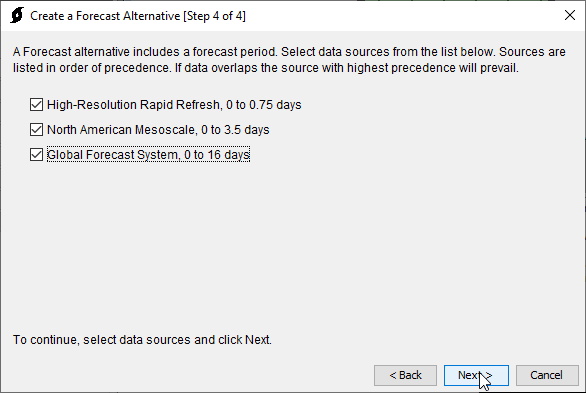
The automated forecast wizard is four steps. In the wizard the user selects a name for the forecast, the basin model for the forecast, look back period data, and forecast period data. The image below shows step four of the wizard where forecasting data is selected. The look back and forecast data is automatically merged in order of precedence.
This feature was funded by through the USACE General Investigations program and the Mississippi River Geomorphology & Potamology program. Initial code implementation and documentation were done by Thomas Brauer. Testing was done by Thomas Brauer.
Output Control
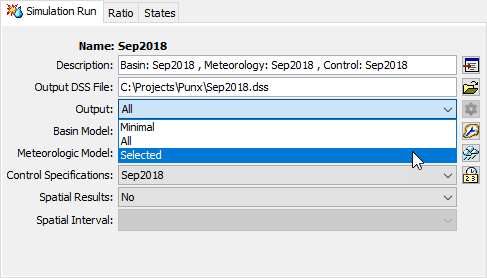
The new Output control options includes minimal, all, and selected options. If the minimal option is selected, only the minimum output required by HEC-HMS will be written. If the all option is selected, all time-series results will be written. If the selected option is chosen, the user can specify which time-series will be written, and select the output interval for the written results. There are some results, like flow from an element, that cannot be turned off. The output control option is available for all compute types. The output control selection on the simulation run component editor is shown below.
The image below shows the custom output editor. The custom output editor is available by selecting the settings icon next to the output selection. Time-series output can be controlled for each element and time-series-type combination. There are table filters for element and time-series type.
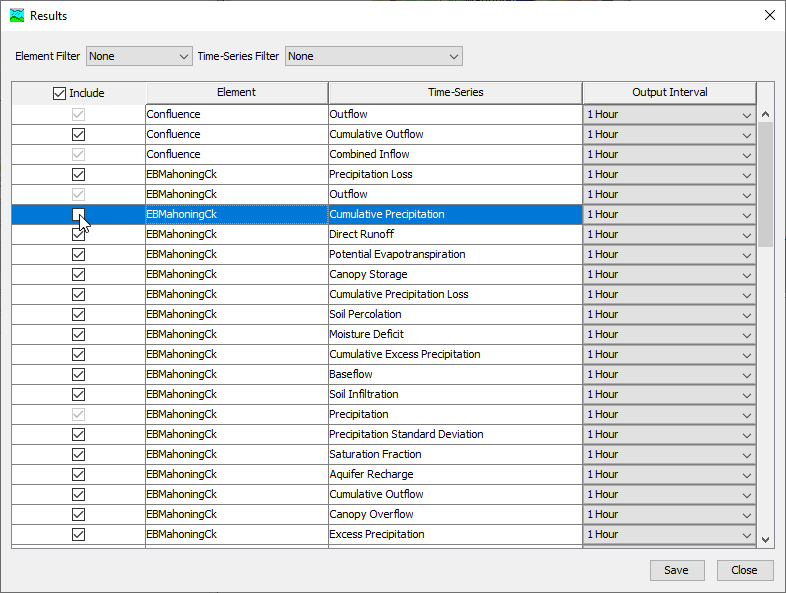
For more details regarding customizable output for a simulation run, see Simulation Results Output.
This feature was implemented as a part of ongoing runtime reduction work. Funding partners include the U.S. Army Corps of Engineers Northwestern Division (Columbia River Basin). Initial code implementation was done by Caleb DeChant, Contractor, Paul Ely, Contractor, and Thomas Brauer. Documentation was completed by Thomas Brauer, Matt Fleming, and Mike Bartles. Testing was performed by the entire HEC-HMS team.
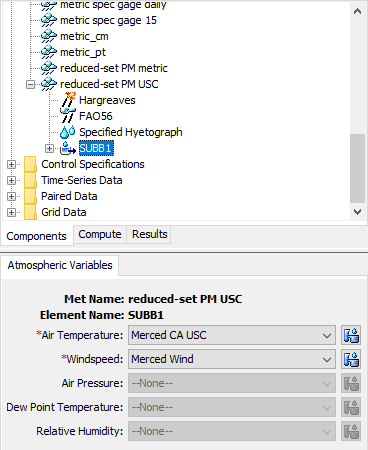
Generalized Meteorologic Processes
In previous versions of the program, some meteorologic boundary conditions were treated as a modeling method, while others were treated as input to a modeling method. In the example below, air temperature and windspeed are selected as parameters to the Penman-Monteith evapotranspiration modeling method.
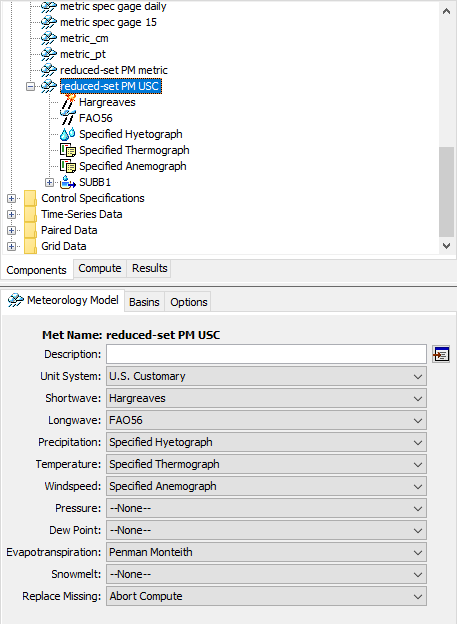
The meteorologic model has been generalized so that all meteorologic processes are treated as a modeling method. In the example below, modeling methods have been enabled for air temperature and windspeed. These will be used as inputs to the Penman-Monteith evapotranspiration method.
Funding partners for this feature include the CWMS National Implementation Program. Initial code implementation was done by Paul Ely, Contractor and Thomas Brauer. Documentation was completed by Thomas Brauer. Testing was performed by the entire HEC-HMS team.
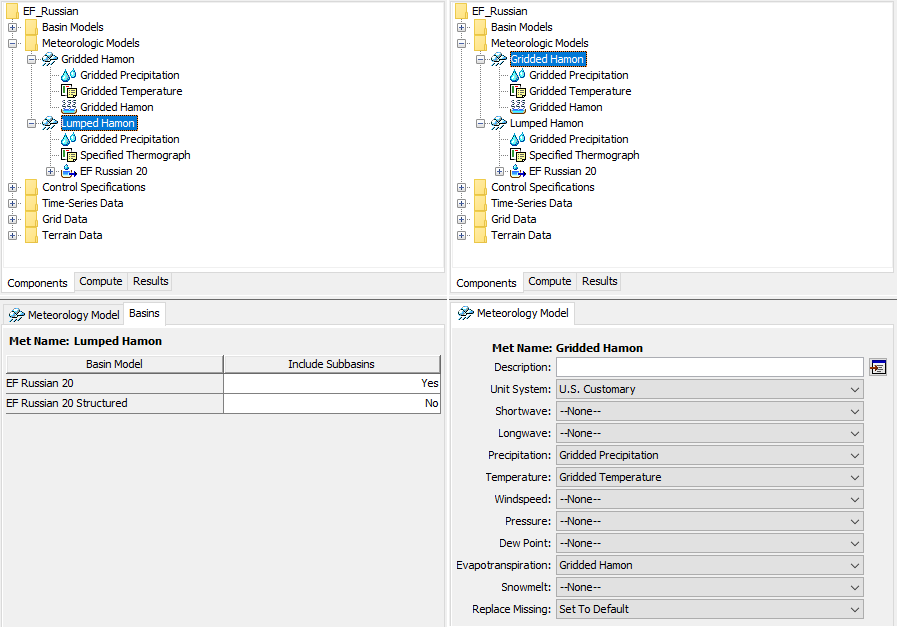
Basin-Meteorology Linking
In previous versions, meteorologic models and basin models had to be linked for a simulation to proceed. Failing to link the basin and meteorolgic model would result in ERROR 15256 at simulation time indicating that the meteorologic model is not set up to work with the basin model. In this version basin-meteorology linking is not required unless the meteorology needs subbasin-level parameterizations. Subbasin parameterizations in the meteorologic model are common for subbasin-average methods and are uncommon for gridded methods. If the meteorologic model uses predominantly gridded methods, the basin-metorologic linking will likely not be required and the Basins tab will disappear from the component editor. If the meteorologic model requires basin-metorologic linking, the Basins tab will be present in the component editor and must be parameterized. The component editor on the left illustrates a meteorologic model that uses the Specified Thermograph temperature method and requires a basin-meteorologic model linking. The component editor on the right illustrates a meteorologic model that uses all gridded methods and does not require basin-meteorologic linking.
Funding partners for this feature include the CWMS National Implementation Program and the USACE Environmental R&D Program. Initial code implementation was done by Paul Ely, Contractor and Thomas Brauer. Documentation was completed by Thomas Brauer. Testing was performed by the entire HEC-HMS team.
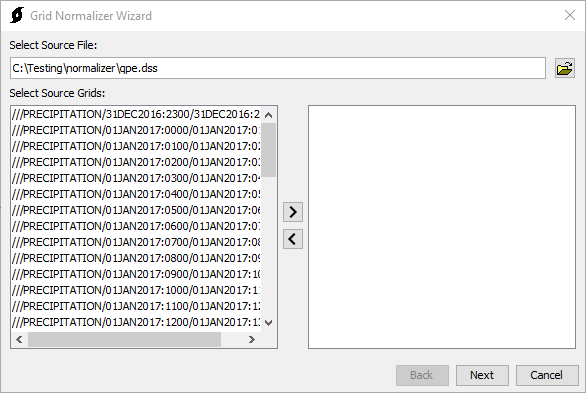
Normalizer Utility
Vortex's Normalizer has been integrated into HEC-HMS as the Grid Normalizer Utility. Its main purpose is to scale grid cells in the source grid by the value of the accumulated normals grid cell over the normalization period, divided by the value of the accumulated source grid cell over the normalization period. This tool is accessible by navigating to Tools | Data | Normalizer.
For more details regarding the Normalizer Utility and its functionality, visit Normalizer Wizard Manual.
This feature was funded by through the USACE General Investigations program and the Mississippi River Geomorphology & Potamology program. Initial code implementation was done by Thomas Brauer and Nick Van. Testing and documentation was done by Garrett Blomstrand, USACE-MVP, and Brett Hultgren, USACE-MVP.
Gridded Data Processing Utilities
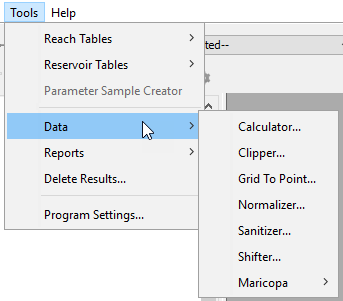
In addition to the Normalizer, the Vortex Calculator, Clipper, Grid-to-Point-Converter, Sanitizer, and Shifter utilities have been added to the HEC-HMS user interface. The data processing utilities are available from the Tools | Data menu. You do not have to have a project open to launch the data processing utilities.
User's Manual documentation to come.
This feature was funded by through the USACE General Investigations program and the Mississippi River Geomorphology & Potamology program. Vortex development is led by Thomas Brauer. User interfaces for HEC-HMS were implemented by Nick Van and Daniel Black. Testing and documentation was done by Thomas Brauer, Nick Van, Daniel Black, Natasha Sokolovskaya, and Simon Evans, USACE-NAB.
Generalized Extreme Value and Four-Parameter Kappa Distributions
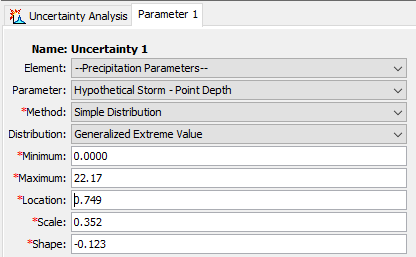
The Generalized Extreme Value (GEV) and four-parameter kappa distributions were added to the Uncertainty Analysis - Simple Distribution list of distributions. They are mainly intended to be used with precipitation parameters, especially the Hypothetical Storm Point Depth parameter as shown below.
Code implementation, documentation, and testing for this feature was performed by Greg Karlovits. This feature was funded by the USACE F&CS R&D program.
Constant Value Error Term - Regression With Additive Error
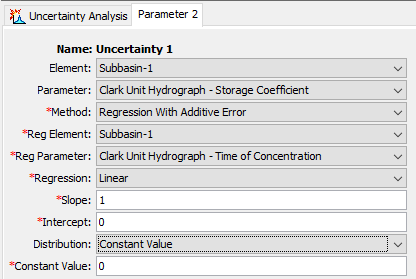
A "constant value" option was added to the distribution choices for the Regression With Additive Error sampling method in the Uncertainty Analysis. This allows the user to specify a completely deterministic relationship between two variables in the sampling scheme. Typically, the constant value will be zero, but the user may specify any value. An example is shown below that ensures, for a single subbasin, the time of concentration (which is controlled by a Simple Distribution method sampler) and the storage coefficient will always be related using the following equation: \frac{R}{t_{c}+R} = 0.5.
Code implementation, documentation, and testing for this feature was performed by Greg Karlovits. This feature was funded by the USACE F&CS R&D program.
Additional Baseflow Parameters Available in Uncertainty Analysis
Parameters for the Linear Reservoir layer fractions were added to the Uncertainty Analysis so that the user can simulate the effects of flow being split between the various groundwater layers. The layer fractions must add up to a value between zero and one, so care must be taken in sampling these values. It is recommended to use the Specified Values sampling method for these parameters to ensure this inequality holds. Alternatively, using the beta distribution paired with the regression with additive error and constant value epsilon term can ensure the fractions add up to a constant value.
The Linear Reservoir baseflow method was expanded to include a third layer in version 4.4; however, its parameters were not made available to the Uncertainty Analysis. In this release, the Groundwater 3 coefficient, number of steps, fraction, and initial condition are available for use in the Uncertainty Analysis.
Code implementation, documentation, and testing for this feature was performed by Greg Karlovits. This feature was funded by the USACE F&CS R&D program.
Simple Canopy Crop Coefficient Available in Optimization Trial and Uncertainty Analysis
The crop coefficient parameter is important for computing actual evapotranspiration in continuous simulations. It can now be optimized using an optimization trial, or its sensitivity explored using the uncertainty analysis.
Code implementation, documentation, and testing for this feature was performed by Greg Karlovits. This feature was funded by the USACE F&CS R&D program.
Global File Reference Table
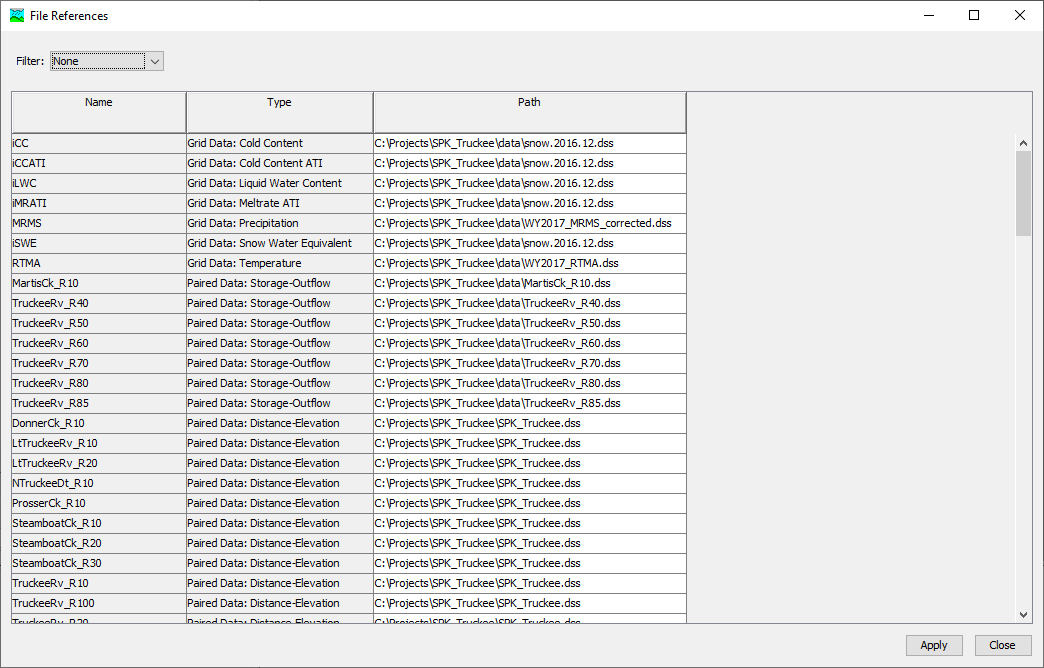
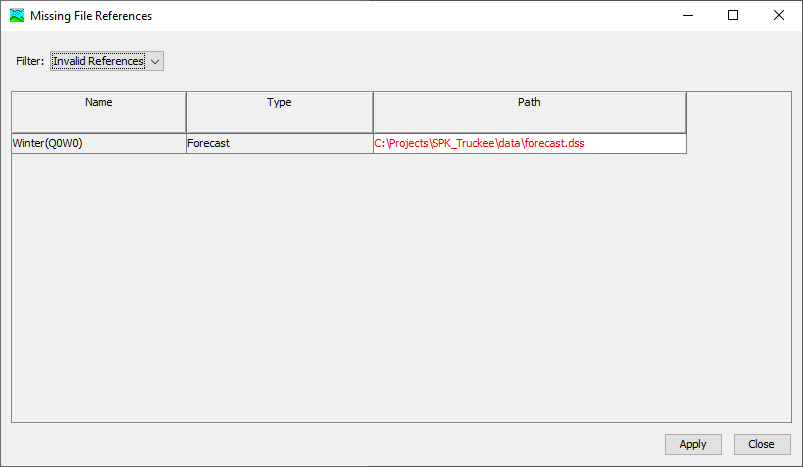
A new global file reference table displays file references for shared data and simulations. The global file reference table is available from the File | References menu. The file path field of the global file reference table is editable by the user.
If a file reference is missing when the project loads, the global file reference table will be launched and filtered for invalid references. This gives the user an opportunity to correct bad file references. In previous versions of HEC-HMS, repetitive dialogs were displayed for each missing file reference.
Funding partners for this feature include the CWMS National Implementation Program. Initial code implementation and documentation was done by Thomas Brauer. Testing was done by Alex Davis.
Default Behavior when File is Missing
In previous versions of the program, if a shared component file was missing, the file path would be automatically changed to the project DSS file. This caused computes to fail at runtime but would introduce confusion when trying to determine to the original file. In this version, the default behavior has been changed so that the path to the missing file is maintained. The compute will fail at runtime, as it should, but the path to the original file will be more obvious to the user.
Missing file references typically occur when file references are made external to the HEC-HMS project. This practice is discouraged by the HEC-HMS team. A data directory has been added to the HEC-HMS project directory. This location is intended to house data that is referenced by the HEC-HMS project.
Funding partners for this feature include the CWMS National Implementation Program. Initial code implementation and documentation was done by Thomas Brauer. Testing was completed by Thomas Brauer and Mike Bartles.
Visual Cues for File References
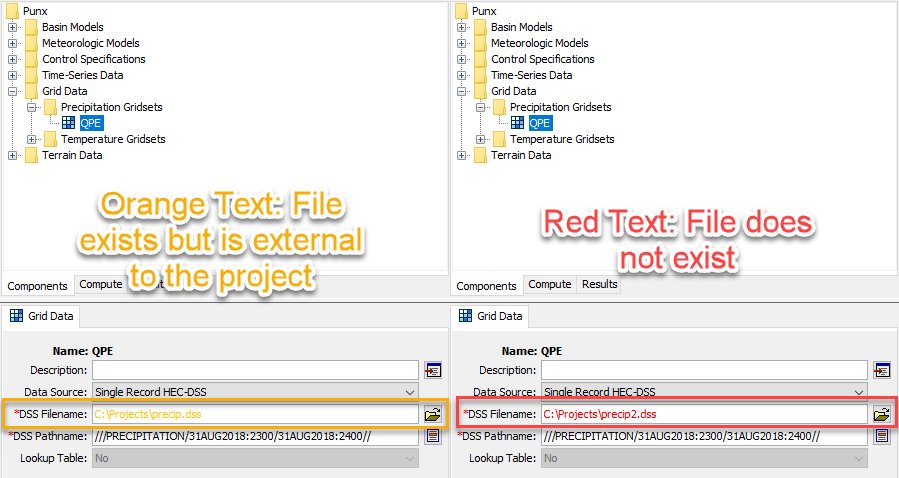
Visual cues have been added to indicate whether a file reference is external to the project, or missing. In the filename text field: if the text is orange, the file exists but is external to the project. If the text is red, the file does not exit. As in previous versions, blue text indicates that the text field has changed since that last time it was saved.
Funding partners for this feature include the CWMS National Implementation Program. Initial code implementation and documentation was done by Thomas Brauer. Testing and documentation was completed by Thomas Brauer and Mike Bartles.
2D Diffusion Wave Transform Enhancements
Both the HEC-RAS and HEC-HMS team make continual improvements to the shared 2D Solver and this release contains the latest rollup of fixes and improvements. These changes were made to improve computational speed, stability, and accuracy of the 2D results. As such, you may notice subtle changes in hydraulic results, most notably to stage hydrographs. Please see the latest HEC-RAS v6.0 release notes for further details.
Initial code implementation and documentation for this feature was performed by Alejandro Sanchez and Mike Bartles. Testing was completed by Alejandro Sanchez, Jay Pak, Matt Fleming, and Mike Bartles.
2D Flow Support for macOS and Linux
Starting from this version, you will be able to take advantage of the advanced 2D flow capabilities in HEC-HMS when working on Windows, macOS, or Linux.
Initial code implementation and documentation for this feature was performed by Richard Rachiele, Contractor and Nick Van. Testing was completed by Nick Van, Alejandro Sanchez, Thomas Brauer, and Mike Bartles.
Pre-packaged Native Dependencies for Linux
Previously, you would have to run a script to install the necessary dependencies for HEC-HMS on Linux. With this update, the native dependencies for HEC-HMS Linux are packaged within the distribution; thereby eliminating the need for you to run the said script. The packaged natives have been tested on Ubuntu 20.04 LTS, and should also work for the more recent versions of Ubuntu.
Initial code implementation, documentation, and testing for this feature was performed by Nick Van.
Optimization using Snow Water Equivalent Time Series
HEC-HMS optimization tools offer two deterministic search algorithms that move from the initial parameter estimates to the final "best" parameter estimates using a variety of objective functions. You can now utilize snow water equivalent (SWE) time series to optimize snowmelt parameters (e.g. Base Temperature, PX Temperature, Wet Meltrate, etc). Five statistical metrics, which measure goodness of fit between simulated and observed time series in a different way, have been implemented for use with SWE time series optimization: Mean of Absolute Residuals, Max of Squared Residuals, Sum of Squared Residuals, Peak-Weighted Root Mean Square Error, and Percent Bias.
Initial code implementation and documentation for this feature was performed by Mike Bartles. Testing was completed by Mike Bartles, Greg Karlovits, and Matt Fleming.
Maricopa Tools
Three new tools designed to facilitate a specific work flow adopted by Maricopa County have been added to HEC-HMS under Tools | Data | Maricopa. Each of the Maricopa tools (Clark, S-Graph, and Green-Ampt) launch a wizard where the user can point to tabular soil and land-use data as well as geospatial soil, land-use, and flow-path data. At the end of the wizard, HEC-HMS performs various table joins and geometry intersections to compute subbasin average parameters. The appropriate global editors and component editors are automatically populated with the computed parameters.
Initial code implementation and documentation for this feature was performed by Thomas Brauer and Josh Willis. Testing was completed by Thomas Brauer, Josh Willis, and Matt Fleming.
Debris Yield Global Editors
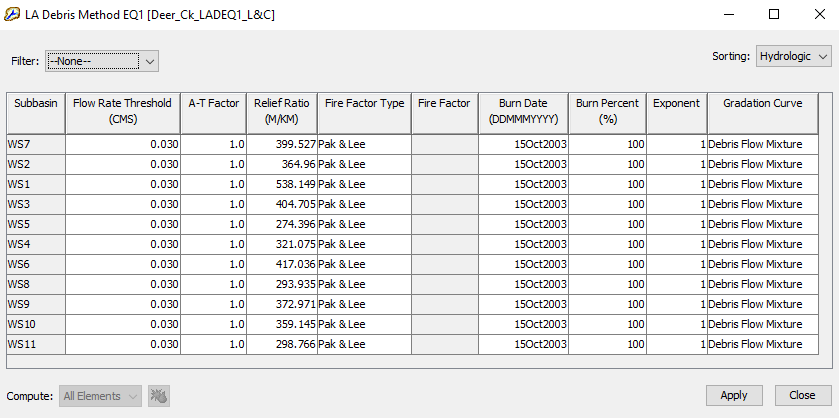
The Global Editor is now available for 5 Debris Yield methods: LA Debris Method EQ1, LA Debris Method EQ 2-5, Multi-Sequence Debris Prediction Method (MSDPM), USGS Long Term Debris Model, and the USGS Emergency Assessment Debris Model. These method parameters previously needed to be entered for each subbasin element but users can now add and modify parameter values in the Global Editor panel.
The debris yield global editors were funded by the USACE Arid Regions work unit within the Flood and Coastal Systems Research and Development program. Initial code implementation, documentation, and testing for this feature was performed by David Ho, Thomas Brauer, and Jay Pak,
Calibration Summary Table
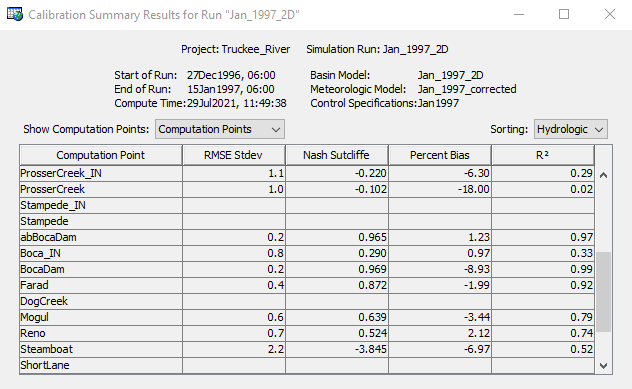
A calibration summary table with statistics can now be accessed via Results | Calibration Summary Table or via the Results tab of the watershed explorer window. RMSE Stdev, Nash Sutcliffe, Percent Bias, and R2 statistics are available for each computation point with observed flow data. This table has been implemented for simulation and forecast alternative compute types.
Initial code implementation and testing for this feature was performed by Josh Willis and Thomas Brauer.
Differential Evolution Optimization Search Method
The Differential Evolution global optimization method was added as a search method to the Optimization Trial. This search method is more robust for multiple parameter optimization than the Simplex search method.
Initial code implementation and documentation for this feature was performed by Greg Karlovits. Testing of this feature was performed by Greg Karlovits and Matt Fleming. Haden Smith (USACE Risk Management Center, RMC) provided an algorithmic prototype of the Differential Evolution algorithm, and unit test examples. This feature was funded by the USACE F&CS R&D program.
Optimization Data Transforms
Two data transformation options were added to the Optimization Trial: log base 10, and Box-Cox. These transforms are applied to the observed and simulated data before computing the objective function. Both transforms estimate a shift parameter to ensure the transformation is always computed on positive values. The Box-Cox transform automatically estimates the power (lambda-1) parameter using a maximum likelihood approach.
Initial code implementation, documentation, and testing for this feature was performed by Greg Karlovits. Haden Smith (RMC) provided an algorithmic prototype of the Box-Cox transformation and parameter estimation. This feature was funded by the USACE F&CS R&D program.
Spatial Results Tooltips and Time Series
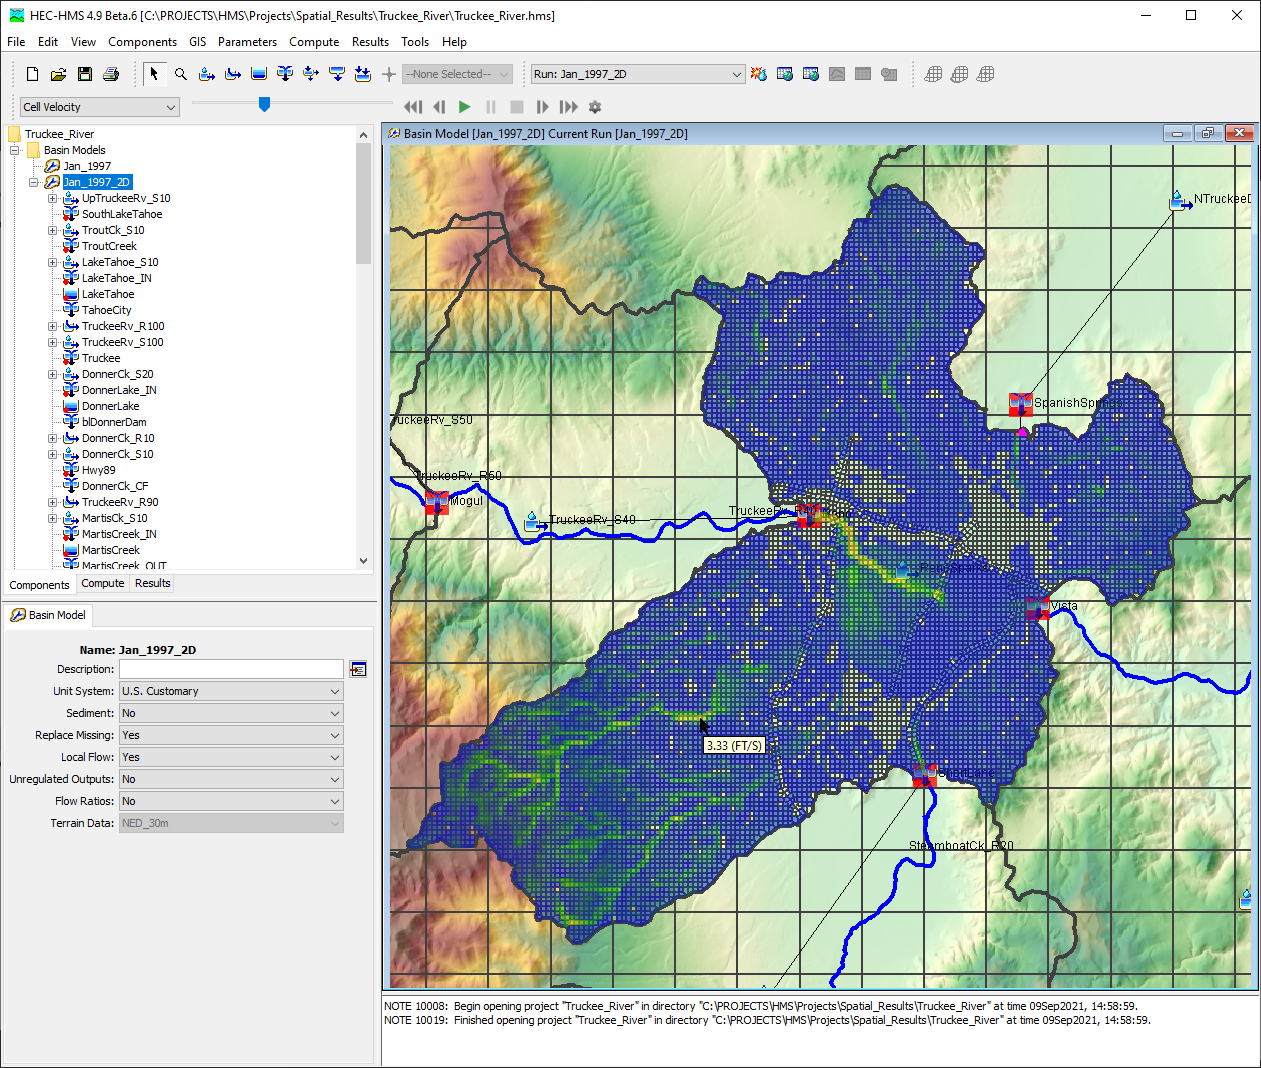
When valid spatial results are selected and you hover over a valid cell, a tooltip denoting the value and units for the selected variable and time step will be shown. Within the following image, Cell Velocity has been selected within the Animation Toolbar, the slider bar has been advanced to 03Jan1997:0200, and the mouse hovered over a cell which contains valid results:
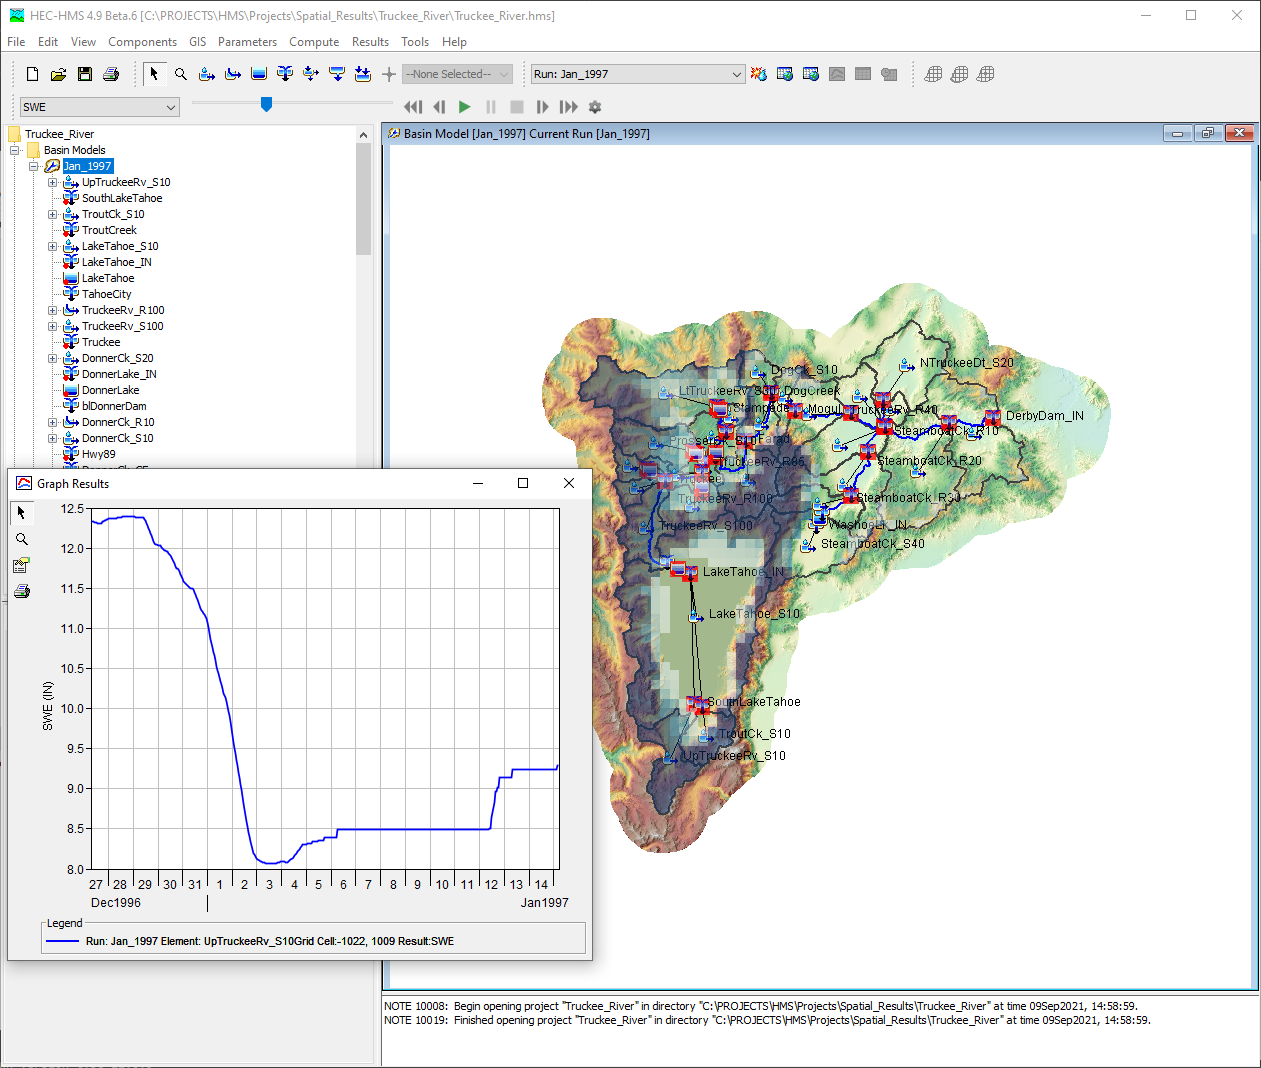
Also, when valid spatial results are selected, a right-click option allows for the display of a time series of the selected variable for the entire simulation time window. Within the following image, Snow Water Equivalent (SWE) has been selected within the Animation Toolbar and the time series plotted by right clicking within a cell that contains valid results and selecting Plot Spatial Results:
Initial code implementation for this feature was performed by Shannon Newbold, Caleb Dechant, and Mike Bartles. Documentation and testing was performed by Mike Bartles and Tom Brauer. This feature was funded by the USACE RMC.
2D Sediment Transport
The 2D Sediment Transport method was developed to work with the subgrid framework of the 2D Diffusion Wave transform method. This Erosion method computes subgrid erosion and deposition rates, bed elevation, gradation, and bed layering. Sediment transport is computed with a non-equilibrium total-load formulation. The total-load transport equation is solved with implicit Finite-Volume methods on the same unstructured polygonal mesh as the 2D flow solver. The Component Editor for this method is shown in the following figure.

Spatial variables specific to 2D Sediment Transport including total/clay/silt/sand/gravel sediment concentration and total/clay/silt/sand/gravel bed change can be displayed within the map. In the following image, clay sediment concentration is shown throughout a subbasin that uses the 2D Sediment Transport Erosion method. Also, videos of total sediment concentration and silt bed change during a flood event are shown below.

Only the Clay Silt Sand Gravel grade scale may be used with this Erosion method. More information pertaining to this feature can be found here. A presentation regarding 2D Flow and 2D Sediment Transport features was made on September 29th, 2021. Materials used during this presentation can be found here while a recording of the presentation can be viewed here.
Initial code implementation, documentation, and testing for this feature was performed by Jay Pak, Alex Sanchez, and Mike Bartles. This feature was funded by the USACE Flood and Coastal R&D program.
Rename Basin Model Elements
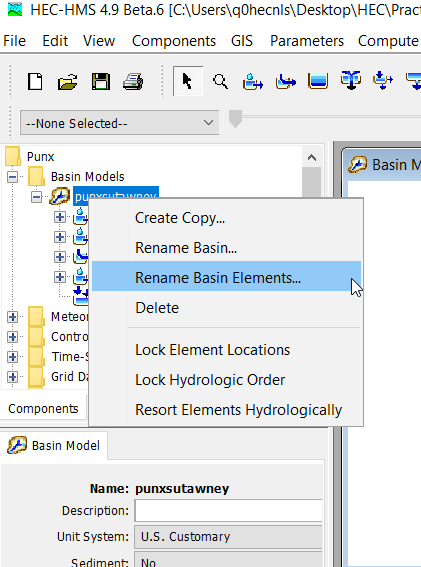
An option was added to rename multiple basin elements from a Rename Basin Elements table that can now be accessed by right-clicking a basin name in the Components tab of the Watershed Explorer, as shown in the following figure.
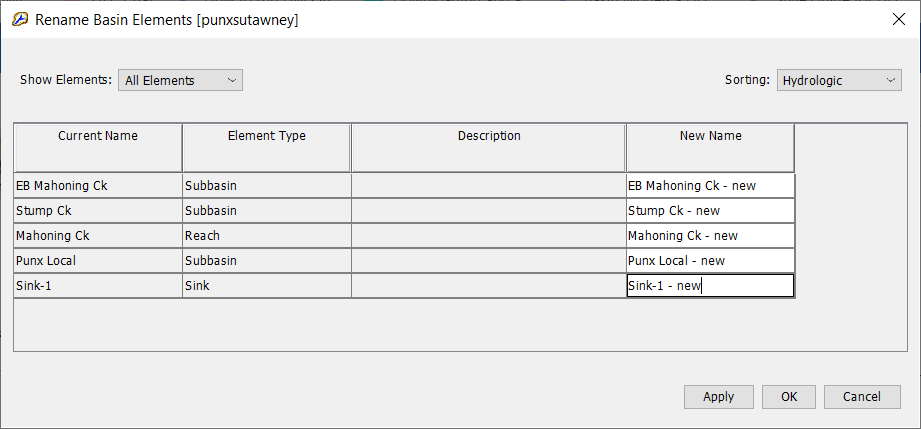
Within this table, multiple basin elements can be renamed at once. Tools to filter by element type (e.g. Subbasin, Junction, etc.) and sort either hydrologically or alphabetically are included to aid in identifying the element(s) of interest.
A demonstration of this new feature can be found here:
Initial code implementation for this feature was performed by Natasha Sokolovskaya. Documentation and testing were performed by Natasha Sokolovskaya, Mike Bartles, and Tom Brauer.
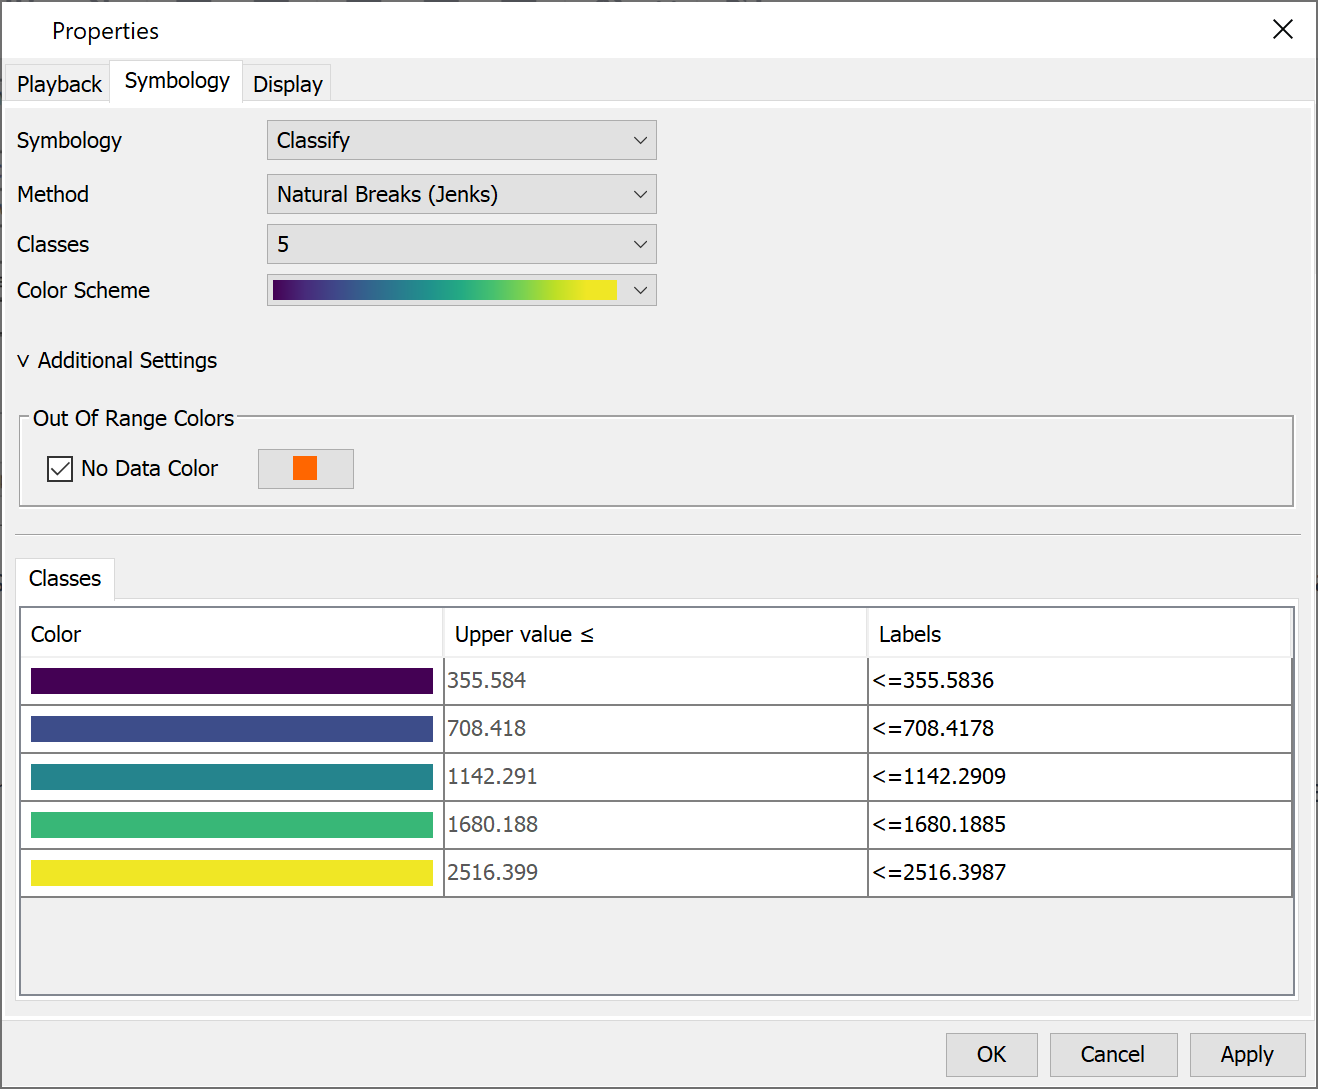
Updated Raster Display Settings Editor
The Raster Display Settings Editor has been redesigned to become more intuitive. With the new editor, the user can choose between two Symbology types: 'Classify' and 'Stretch'. The 'Classify' symbology option allows the user to specify color bins to display the data. An example of the 'Classify' UI is shown below.
Meanwhile, the 'Stretch' option allows the user to specify the max and the min values, and each data point would be mapped to a color corresponding to its position between max and min. For example, in the UI for 'Stretch' option below, if the data value is '16.999' (i.e. the min), it would be mapped to the left-most color of the color scheme (purple-ish in this case).
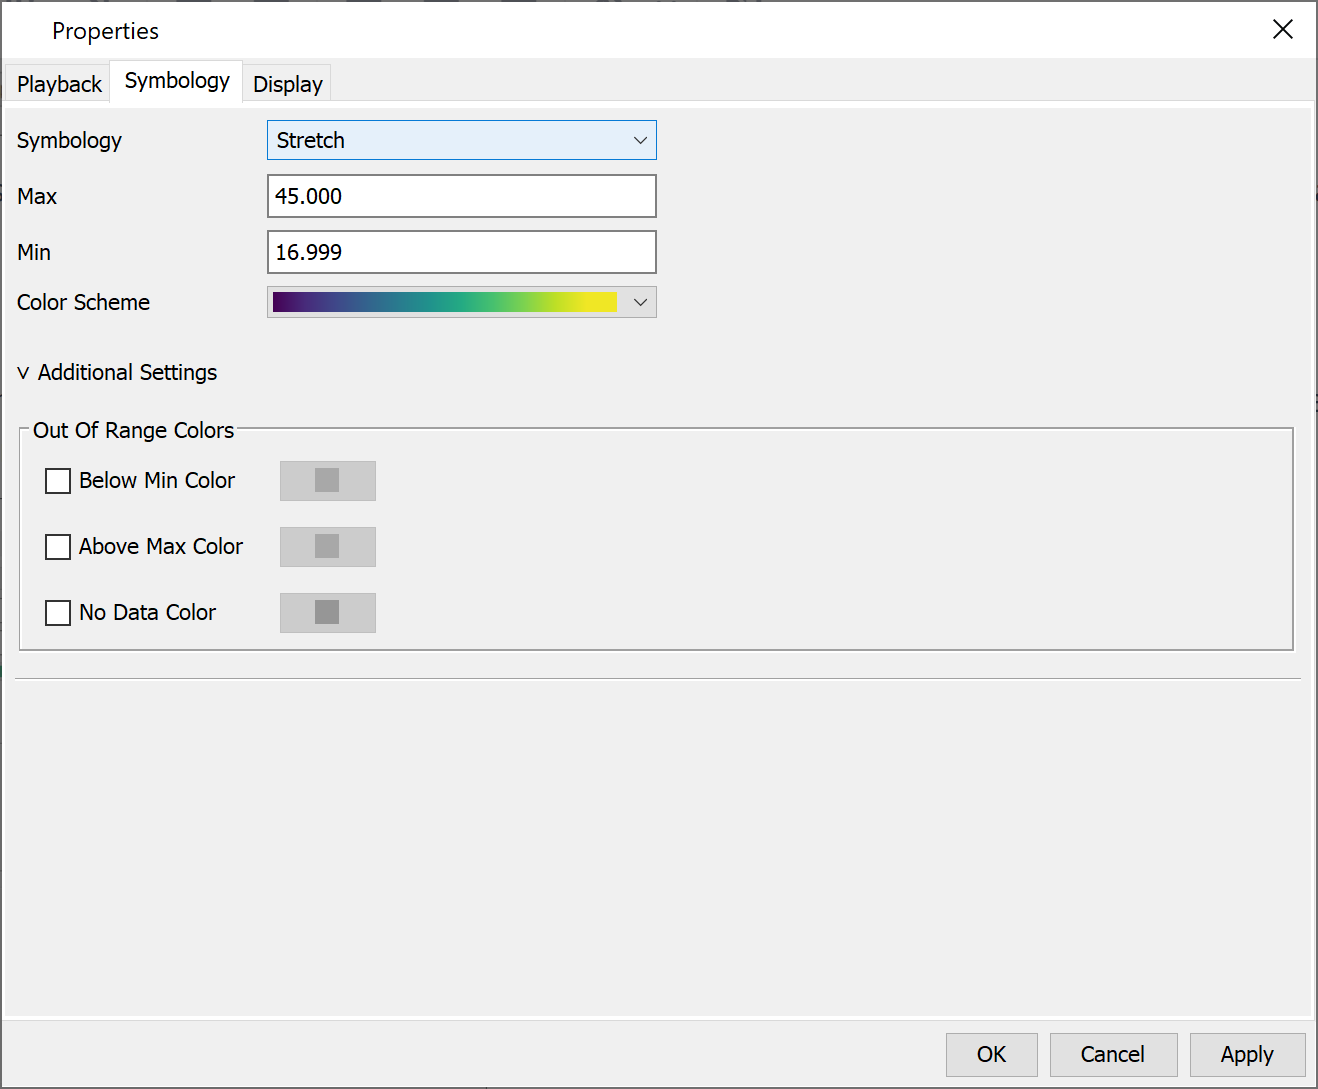
More information pertaining to spatial results can be found here.
Initial code implementation for this feature was performed by Nick Van. Documentation and testing were performed by Nick Van, Mike Bartles, Tom Brauer, and Matt Fleming.
DSS Grid Record Validator
A DSS Grid Record Validator utility was added to help modelers identify issues within their gridded boundary conditions (e.g. precipitation, temperature, SWE, etc) that would prevent a simulation from successfully completing.
Requirements for gridded datasets include:
- number of rows and number of columns remain constant throughout the simulation,
- lower left corner coordinates remain constant throughout the simulation,
- projection (e.g. SHG) remains constant throughout the simulation, and
- grid cell size remains constant throughout the simulation.
Additionally the grid record validator validates each grid record based on the grid type specified. Record requirements are specified in Grid Data and include:
- valid data type (e.g. PER-CUM, INST-VAL),
- valid C-Part,
- valid units, and
- valid start and end times.
This utility can be launched from the Grid Data Manager or by right clicking the Gridset of interest and selecting Validate, as shown in the following image.

The utility will loop over all records contained within the referenced DSS file and check for issues like those noted above. If any issues are encountered, error messages will be shown informing the user, as shown in the following image.

Initial code implementation for this feature was performed by Tom Brauer. Documentation and testing were performed by Mike Bartles, Tom Brauer, and Matt Fleming.
Bugs Fixed
The following bugs were present in previous versions and have been fixed within version 4.9.
Subbasin and Reach Characteristics Not Sorted Correctly
When initially computing subbasin and/or reach characteristics, the resulting list of characteristics was not sorted using hydrologic order though it was reported as such. Logic was added to automatically sort the list of characteristics in hydrologic order.
Outflow for Normal Depth Reach Routing Method Equal to Zero
When using the Normal Depth reach routing method and the initial flow value was equal to zero, all subsequent values were set equal to zero regardless of the inflow to the reach element. The solver has been modified to rectify this error.
Flow Rate Threshold value in Debris Yield Methods
When using the Flow Rate Threshold value in debris yield methods with English units, storm events were not divided correctly for continuous simulation by setting the lower limit for direct runoff flow rate. This occurred due to a unit conversion issue and has been corrected.
No-Data Value Dropped When Computing A Reconditioned Terrain
When using the Terrain Reconditioner, if the original elevation raster file had a No-Data value other than 3.40282e38 it was incorrectly being dropped when writing the reconditioned raster file. This has been corrected so that the reconditioned raster file now maintains the No-Data value from the elevation raster.
Using the Terrain Reconditioning Tool on a Basin Model Name that Contains Hyphens.
When using the terrain reconditioning tool, the "reconditioned.tif" file was not correctly written to disk when the Basin Model name contained hyphens. This has been fixed so that hyphens are correctly handled.
Observed Stage Time Series
Observed and computed stage time series were duplicating observed and computed flow time series. This bug has been fixed such that stage time series are now correctly written to disk and available for graphing/plotting within the user interface.
Importing a 2D Mesh
Three errors were addressed that could be encountered when importing a 2D mesh from an HEC-RAS plan HDF file (i.e. .p##.hdf):
- If the coordinate reference system (CRS) of the HDF file did not match that of the Basin model, errors could arise when attempting to compute. This has been addressed such that the CRS of the HDF file is compared against that of the Basin model when importing. If they are not equivalent, the import is halted and an error message is thrown.
- Currently, HEC-HMS only supports external 2D Connections or boundary condition lines. Previously, no checks were made to ensure that the selected 2D area contained only external boundary condition lines. This has been addressed with a check when importing; if any internal boundary condition lines are encountered, the import is halted and an error message is thrown.
- If the area encompassed by the 2D mesh differs by more than 1% when compared to the selected subbasin, you can now opt to set the subbasin area equal to the area encompassed by 2D mesh. If the area encompassed by the 2D mesh differs by more than 10% when compared to the selected subbasin, the import will now be halted.
Renaming a Subbasin that Uses the 2D Diffusion Wave Transform
Within previous versions, when a subbasin was renamed, the mesh information within the associated .hdf file was not renamed. If you attempted to compute after renaming a subbasin, an error 10000 message was thrown. Now, both the subbasin and mesh information is renamed appropriately.
Standard Report Unable to Generate Report for Depth Area Simulations
The standard report was not generated for Depth Area simulations. This has been fixed so that the Standard Report can generate reports for Depth Area simulations.
Subbasin latitude and longitude assignment after delineation
The subbasin latitude and longitude were incorrectly assigned to subbasin elements after delineation. This bug was introduced in v4.4.
Temperature Index Snowmelt Spatial Results
When writing and/or viewing spatial results for simulations that utilized temperature index snowmelt, the values within Meltrate ATI and Cold Content ATI grids were incorrect. Specifically, Meltrate ATI spatial result values were not being converted to the basin model unit system and Cold Content ATI spatial result values were being treated as depths instead of temperatures. Now, both values are treated correctly.
Univariate Search Parameter Value Unit Conversions
There was a unit conversion error that affected the search values within the Univariate search method (in an Optimization Trial) when the basin model was in the U.S Customary unit system. Specifically, parameters with units that differ between USCS and metric (for example infiltration rate) would not convert correctly during the search. The error would potentially prevent search convergence. The unit conversion issue was fixed.
CAVI/HEC-RTS Annual Pattern Paired Data Issue
When attempting to extract a new forecast using CAVI or HEC-RTS, an error message was thrown indicating that Annual Pattern paired data was not being correctly copied to the new forecast. In actuality, the data was being correctly copied and the error message was unnecessary. This erroneous error message has been fixed and all paired data are correctly copied to the forecast directory.
Tabulating Results for a 2D Connection
Within previous versions, when a 2D Connection time series was tabulated, multiple columns were created within the resultant table. Now, only the selected time series for the 2D Connection will be shown within the table.
Gridded Curve Number Loss Method
In previous versions, the Gridded Curve Number loss method was assumed to only be used with gridded meteorologic models (i.e. meteorologic models that use gridded boundary conditions). If you attempted to compute a simulation that used the Gridded Curve Number loss method with a non-gridded meteorologic model, the simulation failed with no error message. Now, the Gridded Curve Number loss method can be used with both gridded and non-gridded meteorologic models.
Using an Objective Function that Conflicts with the Optimization Trial Compute Window
In previous versions, an Objective Function with a time window that conflicted with the compute window of an Optimization Trial was allowed. For example, an Objective Function that evaluated model performance from 01Jan2000 00:00 to 10Jan2000 00:00 could be used with an Optimization Trial that computed results from 02Jan2000 00:00 to 03Jan2000 00:00. Now, the compute will halt and an error message will be thrown indicating that the Objective Function time window must be within the Optimization Trial compute window. More information pertaining to Optimization Trials can be found here.
Standard Report Failure Due to Error When Attempting to Reformat Project's Title
When attempting to reformat a project name that contains unsupported characters, the Standard Report generator would fail and exit midway through the process. This has been fixed, such that if the program fails to reformat the project name, it would use the original project name.
Standard Report Missing Subbasins
In previous versions, the Standard Report would fail to recognize basin files that did not follow a certain naming convention. Now, the Standard Report is able to locate the correct files based on the selected simulation.
Malformed State Serialization with Gridded Soil Moisture Accounting Loss Method
The Gridded Soil Moisture Accounting loss method was incorrectly saving its state file causing problems initializing states when using a start state file. The Gridded Soil Moisture Accounting loss method now correctly serializes its state. This issue is limited to projects that use Save/Start states with the Gridded Soil Moisture Accounting loss method.
Renaming ASC/GeoTIFF grids from the Grid Data Manager
Support for ASC/GeoTIFF grid data file types was added in a recent version. A bug was fixed that prevented renaming these grids from the Grid Data Manager.
The Percent Impervious Area Adjustment was Applied Twice to Losses Sent to the Linear Reservoir Baseflow Method
The Linear Reservoir baseflow method is passed infiltration or percolation time-series from the selected loss method. A bug was fixed where the incorrect infiltration was being passed to the linear reservoir baseflow method, the impervious area adjustment was applied twice for subbasin elements using the Initial and Constant, SCS, Exponential, Green and Ampt, and the Smith Parlange loss methods.
Optimization Trial Returning Parameter Values Outside the User-Specified Range
The objective function's linear penalty function for out-of-range parameters was not punitive enough to prevent searches from returning optimum parameter values outside of the user-specified range for the parameters. A new penalty function that is exponential instead of linear creates a steeper penalty to the objective function for out-of-range parameters, vastly decreasing the likelihood of the Trial returning optimum parameters that are out of range.
Selecting a New Downstream Connection
In previous versions, when the Downstream connection was changed for a given basin element (e.g. junction), the drop down menu selection would revert to None. This issue has been fixed such that a new downstream connection is correctly saved on the first try without first reverting to None.
Copying a Maximization Goal Optimization Trial Causes a Time Window Error
If a maximization goal optimization trial was copied, changing the time window in the new trial and running it resulted in an error. The error was fixed by adding an additional check for the maximization goal optimization trial time window at runtime.
Grid Editor Panel fails to open on Ubuntu
A NullPointerExecption prevented the Grid Editor Panel from opening on Ubuntu. Logic was added to avoid the NullPointerException and allow the editor to open.
Known Issues
Hamon Evapotranspiration Method will Compute without Temperature Method
Simulations containing the Hamon Evapotranspiration method will compute successfully without an Air Temperature method selected. If the Hamon Evapotranspiration method is selected in the Meteorologic model, and an Air Temperature method is not selected, the simulation will still run successfully. This will occur if the "Replace Missing" option in the Meteorologic model is set to either Abort Compute or Set to Default.
Grid-to-Point-Converter & Calculator Utility
The Vortex Grid-to-Point-Converter was added to HEC-HMS in v4.9. A bug was introduced in the utility in an attempt to update a progress bar in the user interface. As a result the progress bar is inaccurate and the performance of the utility is impacted.
The Vortex Calculator was added to HEC-HMS in v4.9. A bug was found in the utility when attempting to multiply, divide, add or subtract with floating point values. While the user could enter a float value, the compute would not create a DSS file with the updated grids.
Users who want to use the Grid-to-Point-Converter utility or the Calculator Tool are encouraged to use Vortex version 0.10.27 or greater. Standalone versions of vortex can be downloaded here. Alternatively portable distributions of HEC-HMS v4.9 can be updated by deleting the vortex-0.10.26 and vortex-ui-0.10.26 jars and adding vortex and vortex-ui jars, v0.10.27 or greater.
Downloads:
Beta Releases
| Release | Date | Features | Bug Fixes |
|---|---|---|---|
| beta.1 |
|
| |
| beta.2 |
|
|
|
| beta.3 |
|
|
|
| beta.4 |
|
|
|
| beta.5 |
|
|
|
| beta.6 |
|
|
|
| beta.7 |
|
|
|
| beta.8 |
|
|
|
| beta.9 |
|
| |
| beta.10 |
|
|