Task 2: Plot Defaults and Plot Templates
Default Plot Properties
In the previous task, you learned how to change the look of a plot using the Plot Properties Editor. You also learned that the changes were only applied to the plot temporarily. If you would like to configure plot settings to apply to all plots within your watershed, you will need to edit the default plot settings.
Open a new plot if you closed the Calpella plot. From the plot menu bar, select Default Plot Properties from the Edit menu.
The Default Plot Properties Editor will open.
Why is there no place to set the curve line properties on this editor?Because there is no way to predict what curves will be displayed on future plots. You will need to use the Default Line Styles editor for setting curve properties by parameter, data type, and instance.
- Modify the legend title from the Legend tab to display something like I'm Plotting Things…
- Review the other settings available by clicking through the various tabs within the editor.
- Click OK to close the Default Plot Properties dialog.
Default Line Styles
As you discovered in the steps above, there is a separate editor to use when setting default line styles for your plots.
- With a plot open, select Default Line Styles from the Edit menu.
- Scroll through the line styles to view the available names and parameters.
- Set line number 1 for the name Flow to be a dotted red line.
- Set line number 1 for the name Stage to be a dashed dark green line.
Select File → Save from the Default Line Style Options menu bar and close the dialog.
Does your plot show the modifications to the Stage curve? Why or why not?No, because the changes to the default settings only affect plots that are opened after the changes are made.
- Tell the plot to display the Default Line Styles you set by selecting Use Line Styles from the View menu.
Creating a Plot Template
Now that you have some practice with changing the default plot properties and line styles, you will learn how to create a plot template. Plot templates allow you to customize the look of a plot and apply those settings to plots within any watershed. It is a great way to share customized plot settings between users. First you will reconfigure the plot, and then save the template.
- Reconfigure the plot to display stage and flow in the same viewport.
- Select Configure Plot Layout from the Edit menu within the plot window.
- The Configure Plot dialog will open.

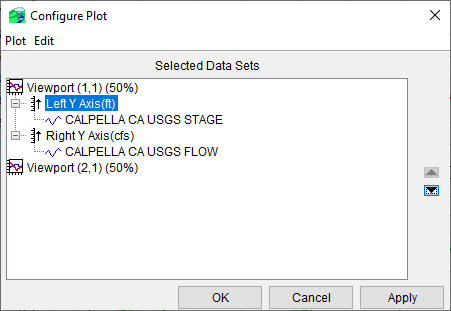
- Select the Left Y Axis (ft) under Viewport (2,1) and click the up arrow button in the right margin to move the axis up to Viewport (1,1). The result should look like the following.

Notice that both data sets are now in the same viewport and that Viewport (2,1) contains no data sets.
Where do you expect the stage and flow to display?Flow on the left axis and stage on the right axis, within the same viewport.
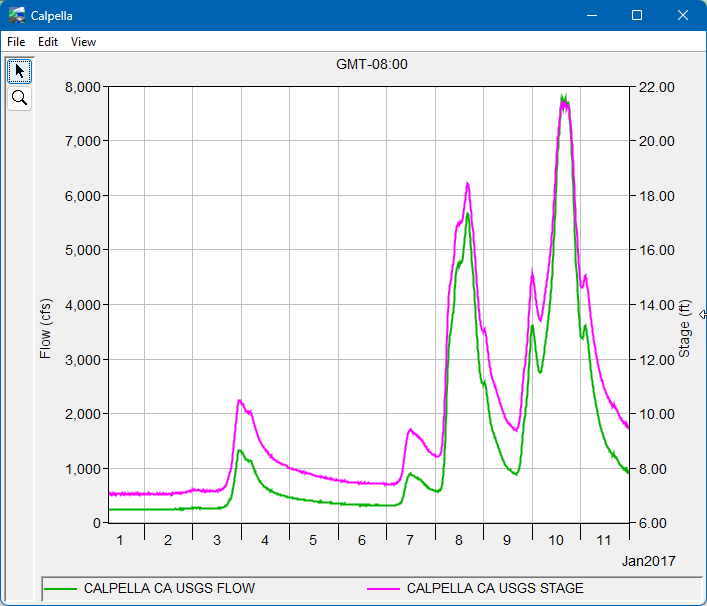
Click the OK button. The plot should now look similar to the example shown below.

- Swap the stage and flow axes.
- Open the Configure Plot dialog.
- Select Edit → Add Viewport from the dialog menu bar.
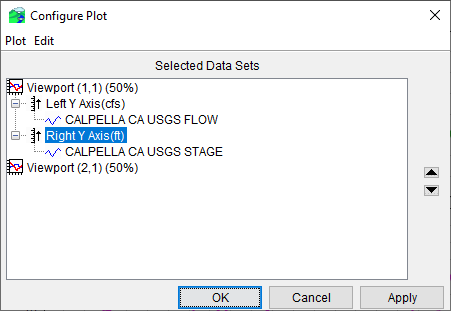
- Select Right Y Axis(ft) under Viewport (1,1) and click the up arrow button in the margin. The result should look like the following.

NOTE: You cannot swap the axes without adding the additional viewport first. - Click the OK button. The plot should now look something like the following.

- Change the appearance of the plot (again).
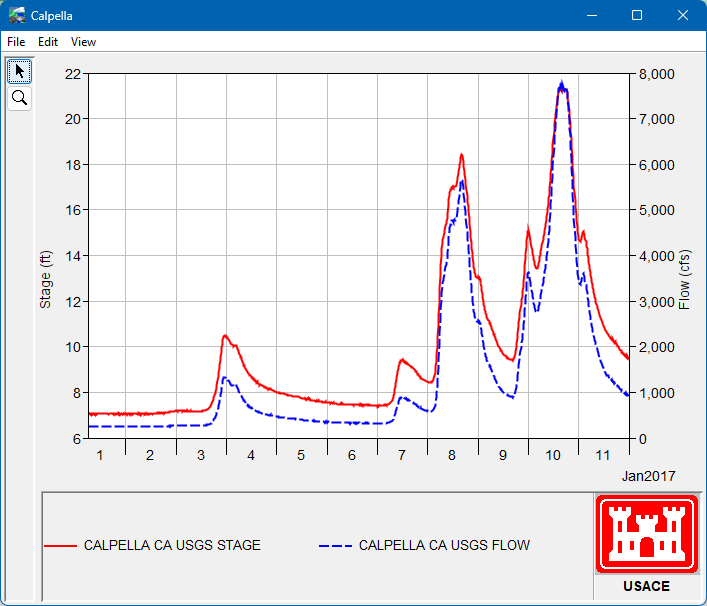
- Using the Plot Properties Editor (not Default Plot Properties), change the appearance of the plot as follows:
- Stage curve should be solid red.
- Flow curve should be dashed blue.
- No legend title.
- In the Right Block tab of the Legend tab, set the text to be USACE in bold text and set the icon file to be C:\CWMS_class\watershed\Workshop_HEC_RussianRiver\shared\castle.gif displayed at the top center position.
- Click OK. The plot should now look something like the following.

- Using the Plot Properties Editor (not Default Plot Properties), change the appearance of the plot as follows:
- Save the current appearance to a template.
- Select Save Template from the File menu within the plot.
- Navigate to the C:\CWMS_Class\watershed\Workshop_HEC_RussianRiver\shared directory.
- Enter Stream Gage for the name of the template
- Click the Save button.
- Close the plot.