Task 5: Troubleshoot the Plot Script
Run the Plot Script
- Ensure the script is active by double-clicking the Stage+Flow script from in the Script Editor tree pane.
- The File: field above the Editor Pane should show Stage+Flow.py. If it shows CAVI3_Utils.py you need to make sure you double-click Stage+Flow in the tree to the left of the window.
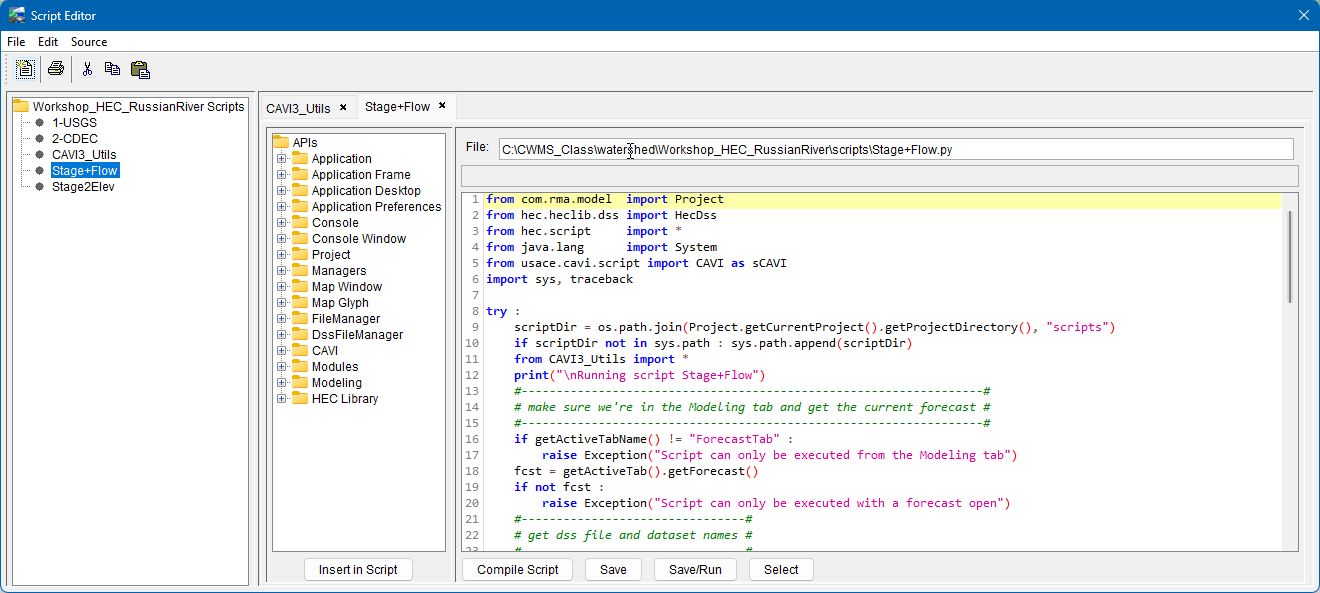
- The File: field above the Editor Pane should show Stage+Flow.py. If it shows CAVI3_Utils.py you need to make sure you double-click Stage+Flow in the tree to the left of the window.
- Click the Save/Run button.
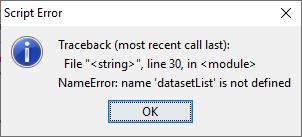
- You should see an error message. When you select OK, another window will open.
Troubleshoot the Plot Script
- Examine the line where the error occurred. It prints the contents of a variable named datasetList. Notice that the previous line defines that variable, but it is commented out.
- Edit line 29 to uncomment the variable assignment.
- Delete just the # character (or a shortcut is to use Ctrl + /, this shortcut can toggle the comment for multiple lines of selected code).
- Don't delete the space to the left of the # character. If you accidentally do so, restore it using the tab key and NOT the space bar.
- The character before datasetList should be a tab character, and it should line up vertically with the next line as shown in the screenshot below.

- Try to run the script Save/Run and see what happens.
- There should now be a different error message.

- This error is saying that a function called Plot is trying to be utilized, but it has not been defined. This usually means an import was skipped.
- If you look at the top lines of the script, there is an import utilizing a wildcard import (the asterisk). This is no longer supported in CWMS (many older scripts utilized this syntax).
- To fix this issue, search the JavaDocs to try to determine exactly what import we need.
- The JavaDocs can be found within the CWMS folder (not the Watershed folder, but the folder where the CAVI application is running from - CAVI/javaDocs/index.html).
- Go to the INDEX option and select the P to go down the the section start with P, and find Plot.
- Then use the find function (crtl+f in windows) to locate Plot. You should see the same as below.

- Looking back at the top of the script, you should see there is an import hec.script trying to use the asterisk. Lets see if there is an import using that method.
- If we look at the end of each line, it tells what method or constructor is for the function.
- Notice that there is an instance of hec.script that a plot is located with (hec.script.Plot). So lets try to remove the asterisk and enter Plot in its place.
Add the Plot Script to the Modeling Tab
- Select the Scripts tab at the bottom of the Modeling tab.
- Right-click in the Scripts area and select Edit from the context menu.
- The Select Scripts dialog will open.
- Either double-click on the Stage+Flow entry in the Available column, or select that entry and click the Add button. Either action will move the Stage+Flow entry to the Selected column.
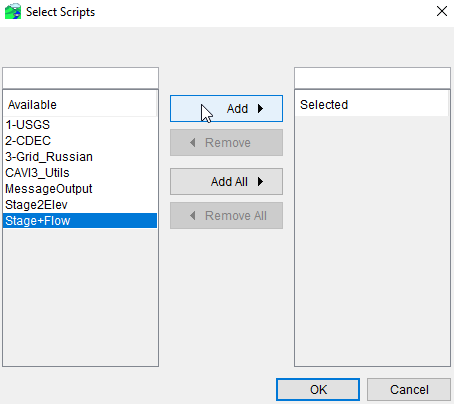
- Click OK from the Select Scripts dialog to close the window.
- The script should now appear in the Scripts area.
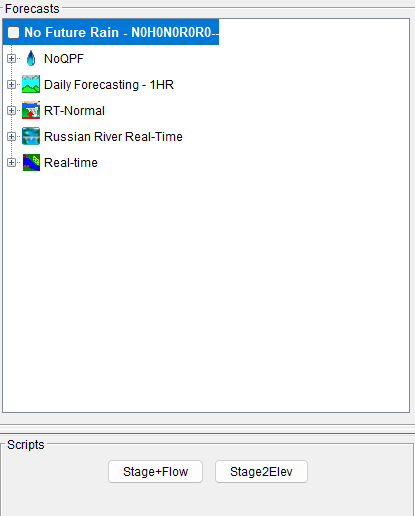
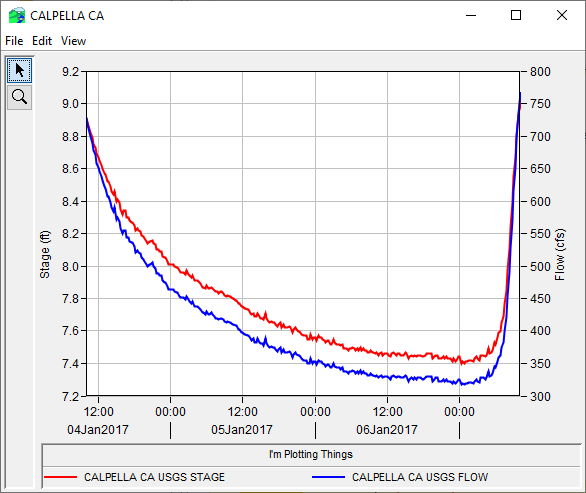
- Click the Stage+Flow button in the Scripts area to run the script. You should see the following plot.

Edit the Plot Script
Now, you will edit the script to change a few of the plot settings.
- As shown below, change the line from vp2.addCurve(“Y1”, flowData) to vp1.addCurve(“Y2”, flowData)
- Delete the line vp2 = layout.addViewport()


- This change will cause the script to plot both curves within the same viewport.
- Save and Run the script. You should see the following plot.
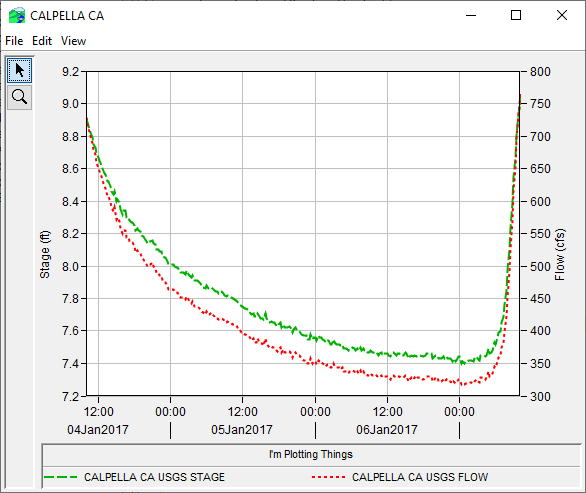
Add the following lines below line 70. Be sure to insert a tab character at the start of each line. These edits will change the line styles for the plot.
stageCurve = plot.getCurve(stageData) flowCurve = plot.getCurve(flowData) stageCurve.setLineColor("red") stageCurve.setLineStyle("solid") flowCurve.setLineColor("blue") flowCurve.setLineStyle("solid")CODEMake sure that the indention level is the same as above. You might have to tab some lines.
- Save and Run.
You should see a plot like the one below.
