Now you will learn how to set up a plot script to plot some data.
Select the Setup tab.
Open the watershed's shared folder.
Right click the Watershed folder in the Setup tab and select Browse Watershed Folder.
Open the shared folder in the file explorer. Leave the explorer window open for later steps.
Select the Modeling tab.
Select Open from the Forecast menu and choose the forecast CWMS Graphics and Scripting.
Select Editor from Scripts menu to launch the Script Editor.
Click the new script tool from the tool bar.
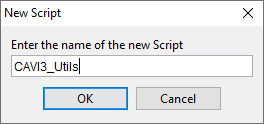
Enter CAVI3_Utils in the New Script dialog and click the OK button.
Return to the file explorer (step 2 b) and double-click the CAVI3_Utils.txt to open the file in Notepad.
Using standard copy/paste methods, copy all the text from the CAVI3_Utils.txt into the Editor Pane of the Script Editor.
Click the Compile Script button. This step is not really necessary but is useful here because the CAVI takes a long time to compile its first script, but after that initial process it is very quick.
After a moment or two, you should see the message shown below.
Click OK to dismiss the message.
Click the Save button on the Script Editor to save your new script.
Close Notepad.
Use the same method to create a new script named Stage+Flow.
The script can be found in the Stage+Flow.txt file saved in the watershed's shared folder.
Save the Script and Close the Editor.
The Stage+Flow script is the one you will use for this workshop. The CAVI3_Utils script contains helper routines used by Stage+Flow.