Download PDF
Download page v.4.4.0 Release Notes.
v.4.4.0 Release Notes
Version 4.3 of the Hydrologic Modeling System (HEC-HMS) was completed in November 2018 and released for general use shortly thereafter. A number of new capabilities have been under development since 2018. The most significant addition to the program is the new GIS toolkit for subbasin and reach delineation. The new delineation tools process terrain information, digital elevation models, and allow the modeler to customize subbasin and reach outlets while preserving the element connectivity. The HEC-HMS team is migrating similar functionality from HEC-GeoHMS directly into HEC-HMS. The team believes the GIS tools will improve the workflow for creating new projects while also improving long term code maintenance. HEC-HMS version 4.4 includes delineation options, future releases will include options for computing physical characteristics of subbasins and reaches and tools for estimating model parameters from common GIS data sets. This release also contains new hydrologic process simulation options and improvements to existing options. The new Layered Green and Ampt loss method can be used for continuous simulation. The linear reservoir baseflow option was enhanced and now provides an additional groundwater layer and options for specifying the distribution of infiltrated water between the groundwater layers. HEC-HMS version 4.4 allows modelers to define snowmelt parameters for each subbasin element and new evapotranspiration options. Finally, HEC-HMS version 4.4 contains improvements to the simulation framework that should translate into noticeable reductions in the simulation run time. A list of new options are described later in this document.
Users have reported some difficulties with several features. The development team has also continued careful and systematic testing of the program. The results of that testing in combination with reports from users have allowed the identification and repair of various problems. Some of these problems affected simulation results and are described in detail later in this document.
The combination of new capabilities and error corrections is this Version 4.4 release. It is currently available for the Microsoft Windows® operating system and the Linux® operating system.
The HEC-HMS program has been designed to be easy to use. However, an understanding of how the program works is critical to producing accurate results. It is suggested that a new user read the HMS Quick Start Guide (Version 4.4 March 2020). The guide briefly describes the basic features of the program in enough detail to begin using it. The guide also includes a step-by-step tutorial.
Installation
The installation package and all documentation are available on the HEC website at https://www.hec.usace.army.mil/software/hec-hms/downloads.aspx. This new release is installed independently of any previous versions of the program so you will need to uninstall the previous versions if you do not wish to use them anymore. However, you may keep different versions of the program installed for parallel use or testing if you choose. This new version will automatically open projects developed with any previous version of the program. However, once a project has been opened in Version 4.4, it will not be possible to open it with older versions of the program.
New Capabilities
GIS Delineation Tools
Basic watershed delineation tools are now provided, which allow the user to create a basin model from a digital elevation model. After assigning a terrain data component to a basin model, the user can apply tools to remove sinks, compute flow direction and accumulation, identify streams by drainage area, define break points, and finally, delineate a watershed. Once the watershed has been delineated, the user also has tools to merge and split sub-basin and reach elements. For more, see GIS Delineation Tools.
Layered Green and Ampt Loss Method
A Green and Ampt option has been available in HEC-HMS for computing precipitation losses. An additional layered Green and Ampt loss method was added in v4.4. This method uses two soil layers to account for continuous changes in moisture content and is based upon algorithms originally developed for the Guelph Agricultural Watershed Storm-Event Runoff (GAWSER) model. Using the layered Green Ampt method allows for continuous simulation when used in conjunction with a canopy method that will extract water from the soil in response to potential evapotranspiration computed in the meteorologic model. For more, see Layered Green and Ampt Loss Method.
Gridded Hamon Evapotranspiration Method
A gridded implementation of Hamon evapotranspiration was added in v.4.4. This adds spatial complexity to the subbasin-average Hamon evapotranspiration method that was added in v.4.3. The method uses average daily temperature data combined with latitude and longitude to compute evapotranspiration according to the methodology of Hamon, 1963, Eq. 2. The Hamon coefficient is set to a default value of 0.0065 and can be adjusted by the user. If the simulation time interval is sub-daily the daily evapotranspiration amount is distributed between sunrise and sunset according to a sinusoidal pattern. For more, see Gridded Hamon Evapotranspiration Method.
Gridded Hargreaves Evapotranspiration Method
A gridded implementation of Hargreaves evapotranspiration was added in v.4.4. This adds spatial complexity to the subbasin-average Hargreaves evapotranspiration method that was added in v.4.3. The method uses average daily temperature data combined with solar radiation to compute evapotranspiration according to the methodology of Hargreaves and Samani, 1985, Eq. 1. The coefficient is set to a default value of 0.0135 and can be adjusted by the user. When the Hargreaves evapotranspiration method is combined with the Hargreaves radiation method the evapotranspiration calculation takes the form of Hargreaves and Samani, 1985, Eq. 8. The user can control the coefficient through the Hargreaves shortwave and evapotranspiration methods. For more, see Gridded Hargreaves Evapotranspiration Method.
Green and Ampt Loss Method
Two methods for specifying the initial soil moisture state at the beginning of a simulation have been added to v4.4: Initial Content and Initial Deficit. The initial content was the only option available in v4.3. The Initial Content method allows the user to specify the initial soil moisture state in terms of a moisture content. Conversely, the Initial Deficit method allows the user to specify the initial soil moisture state in terms of a deficit. For more, see Green and Ampt Loss Method.
Linear Reservoir Baseflow Method
Enhancements were made to the linear reservoir baseflow method for v4.4. The user can now control the number of layers from 1 to 3. Prior to v4.4, up to two layers were available. The other enhancement is the ability to assignable a fraction of infiltrated water to each of the linear reservoir layers. The assigned fractions of infiltrated water do not have to add up to one, and the sum cannot be larger than one. When the sum is less than one, the model is simulating a portion of the infiltrated water going to a deep aquifer and not contributing to runoff. For more, see Linear Reservoir Baseflow Method.
Clark Transform Maricopa County AZ Method
The Clark unit hydrograph method now contains a Maricopa County AZ USA option. The Maricopa County option uses physical characteristics of the watershed and precipitation intensity to compute the time of concentration and the storage coefficient. The user must enter the length of the hydraulically longest flow path, the watercourse slope of the longest flow path, and a resistance coefficient. The program will automatically compute the time of concentration and storage coefficient using the physical characteristics and equations defined in the Maricopa County Drainage Design Manual. A copy of the Hydrology chapter in the Maricopa County Drainage Design Manual can be opened from the following website, https://www.maricopa.gov/546/Engineering-Tools. For more, see Clark Transform Maricopa County AZ Method.
Compute to Point Expansion
When elements are designated as Computation Points, additional computation options become available. One of these options is Compute To Point, which only computes the hydrologic element designated as a computation point plus any elements upstream of the point. This computation option allows users to more quickly perform simulations, evaluate chosen modeling processes, and calibrate model parameters, which is especially useful when forecasting during times of flooding. While users can still access the Compute To Point feature by right-clicking on a computation point in the Basin Model Map and selecting Compute To Point, additional means by which users can access this feature have been made available within v4.4. For instance, within the Zone Parameter editors, a Computation Point can be selected and all hydrologic elements upstream can be computed. This new feature is also available within all global parameter editors and forecast initialization editors. For more, see Compute to Point Expansion.
Melt Rate Options for Temperature Index Snow Method
In past versions, the antecedent temperature index - meltrate (ATI-meltrate) parameter was specified as a paired data function. Two new ATI-meltrate options were added: ATI-meltrate can now be specified as a constant value or a time-variable pattern. To use a constant value, Constant Value should be used for the temperature-index snowmelt dry melt method. To use a time-variable pattern, Annual Pattern should be used for temperature-index snowmlet dry melt method. The time-variable pattern is entered as a Parameter Value Pattern paired data. For more, see Melt Rate Options for Temperature Index Snow Method.
Subbasin Level Temperature Index Parameterization
In past versions, temperature-index snowmelt was parameterized with a single set of parameters for the entire basin. Now, temperature index parameters (i.e. PX temperature, base temperature, wet meltrate, ATI-meltrate function, etc) are specified for each subbasin. This gives the modeler greater control for situations where parameters might vary throughout the modeling domain. For pre-v.4.4 projects, opened in v.4.4, basin parameters will be applied to all subbasins in the basin model. For more, see Subbasin Level Temperature Index Parameterization.
Hypothetical Storm Enhancements
New temporal pattern options were added to the hypothetical storm precipitation method. In addition to the standard 24-hour SCS temporal patterns, the user can select a user-defined temporal pattern or define a series of temporal patterns for increasing storm areas. The user defined temporal pattern is entered as a percentage curve in the Paired Data Manager. The independent variable is percent of the total storm duration (values should be 0 to 100 percent) and the dependent value is percent of the point depth (which is automatically reduced based on the area-reduction information and storm area). The area-dependent temporal pattern option is designed to work in conjunction with the Depth-Area analysis compute option. When the area-dependent pattern option is selected, the user must define a number of storm temporal patterns for different storm areas. HEC-HMS interpolates between the temporal patterns using the user defined storm area, or the area for an analysis point in the Depth-Area analysis. The hypothetical storm precipitation method can now function within the depth-area analysis simulation. The drainage area at each analysis point is used to update the temporal pattern (if it is a function of area) and/or the precipitation depth (if the TP40 or user-specified area-reduction options are chosen). For more, see Hypothetical Storm Enhancements.
Terrain Data
A new shared data element for defining terrain data has been created. The terrain data component stores a single, continuous digital elevation model (DEM) and its vertical units, and can be linked to one or many basin models to be used for watershed delineation. When linked to a basin model, the elevation data will be displayed as a raster in the basin map window. For more, see Terrain Data.
Color Ramp and Scale Editor
Enhanced tools for visualizing raster data in the basin map have been created
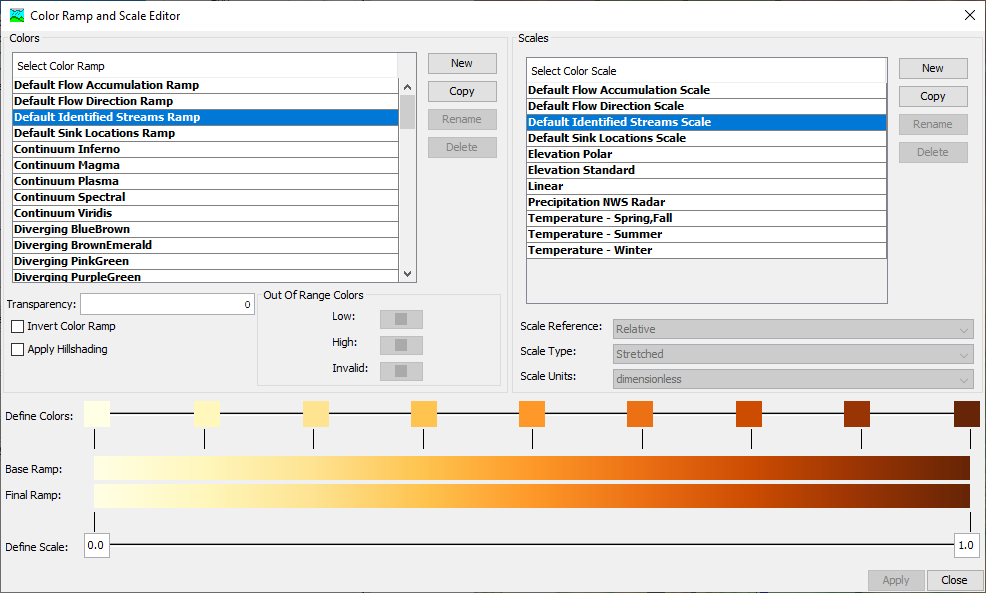
- Raster visualization is controlled by a combination of a color ramp, which defines the colors that values in the raster are mapped to, and a color scale, which determines how values in the raster are mapped.
- A number of default color ramps and color scale schemes are provided. Users cannot modify existing ones but can copy them, or create entirely new ones.
- Color scales are defined as relative (0 - 1 scale representing a fraction) or absolute (predefined values.) They may also be discrete (same color for a range of values) or stretched (interpolated.) Absolute scales may have units.
- Users can change transparency, invert the color ramp and apply hillshading as toggled options.
- Colors used to identify out of range (above or below the scale) or values that are invalid can be set by the user.
- Users can interact with the full color scale by setting the "thumbs", which are reference points that define how the color ramp, or the scale, change throughout the range of the raster values.
- Users can add, delete, and equally distribute thumbs. For color ramp thumbs, users can set the color. For color scale thumbs, users can set the scale value.
For more, see Color Ramp and Scale Editor.
Enhancements and Revisions
Occasionally it becomes necessary to revise how an existing feature operates in order to create more capability or correct a problem. Several changes of this nature have occurred since the last software release. A complete description of each enhancement or revision is given below. In general, revisions result in changes in the computed results when compared to previous program versions.
Basin Map Mouse Controls
The Arrow, Pan and Zoom tools have been removed from the Components toolbar. Instead of box-selection being the default behavior of the click-and-drag action in the basin map, the behavior is now to pan instead. The mouse scroll wheel still controls the zoom, but now the "+" and "-" controls also increase and decrease the zoom level, respectively.
Sediment Channel Routing Computations with Index Flow/Celerity
Any reach element that uses Muskingum-Cunge or kinematic wave routing will need to carefully identify either the index flow or index celerity parameters when sediment transport is being modeled. The computed flow has been found to not be sensitive to the index flow and celerity parameters, but sediment transport has been found to be sensitive to the index flow and celerity parameters. As described in the User's Manual, the index flow and celerity parameters are used to subdivide the reach element into a number of equal length segments (dx). The volume ratio and linear reservoir sediment routing methods are very sensitive to the number of reach segments; therefore, care will need to be taken when defining the index flow or celerity and the model will need to be calibrated. For more, see Sediment Channel Routing Computations with Index Flow/Celerity.
Parallelization of Sub-basin and Reach Network Computation
Simulation performance has been increased through parallelization of the sub-basin and reach network computations. Performance gains are larger in more dendritic models, and the gain drops off as the number of diversions and auxiliary flows increases. Improvements of up to 50% in simulation time have been demonstrated, and models with more elements have shown the greatest increases.
Name | Type | Area | Duration of Simulation | Compute Time | ||
|---|---|---|---|---|---|---|
| v4.3 | v4.4 | Compute Time Reduction (%) | ||||
Garrison Dam | Dam Safety | 123,659 | 121 | 23 min 2 sec | 19 min 11 sec | 16.7 |
Delaware River | Forecasting | 13,635 | 31 | 43 sec | 33 sec | 23.3 |
Upper Susquehanna River | Forecasting | 4,938 | 20 | 25 sec | 13 sec | 48.0 |
Potomac River | Forecasting | 11,898 | 30 | 27 sec | 14 sec | 48.1 |
Upper Snake River | Planning | 35,872 | 365 | 17 min 31 sec | 17 min 18 sec | 1.2 |
Lower Snake River | Planning | 38,231 | 365 | 9 min 5 sec | 5 min 31 sec | 39.3 |
Middle Columbia River | Planning | 25,830 | 365 | 4 min 25 sec | 2 min 53 sec | 34.7 |
Willamette River | Planning | 11,464 | 365 | 2 min 59 sec | 1 min 44 sec | 41.9 |
Control of Messages
Users can now choose to suppress notes and warnings (but never errors) in the program console and the log file through the Messages tab of the Program Settings menu.
Problems Repaired
Several errors were found in the program and repaired. Complete descriptions of each error are given below.
Summary Information for Total Diverted Flow was Not Correct
Diversion volumes were being reported incorrectly for diversion elements due to a bug related to checking unit systems. This problem has been repaired.
Unrecognized Changes in Objective Function
Changing some properties of an Optimization Trial objective function were not marking the optimization as needing to be recomputed. This problem has been repaired.
Missing Inflow to a Diversion
Error checking was added to prevent diversion elements from attempting to divert flow with missing data when missing values are not allowed in the basin model.
Renaming Junctions Adds Element to List of Subbasin Zone Elements
When junctions were renamed, the junction element was added to the list of subbasins in all zones, which should not include junction elements. This problem has been repaired.
Blending Allowed Missing Percentage
Entered values for Allowed Missing were disappearing when the Apply button was being clicked in the combined parameter editor. This problem has been repaired.
Report Drainage Area Precision
Drainage areas in simulation run reports were being reported to two decimal places regardless of how it was set in the basin model. It has been modified to use the same precision for output as it received for the input.
Optimization of Manning's n Value
Attempting to optimize a reach element with the Muskingum-Cunge routing method allows the user to select Manning's n value as a ratio to the start value. When attempting to actually run the trial, an IllegalArgumentException was being thrown. This problem has been repaired.
Reservoir Storage Is Incorrect When Using FT:FT2 Elevation-Area Function
A bug related to checking the units for elevation-area table data was repaired so that FT:FT2 units will now compute correctly.
Un-editable Text Boxes
A bug that made a text field unresponsive to anything except deleting default text the first time a text field was encountered in a new project was repaired.
Out-of-Memory Error from Opening and Closing the Basin Map
A memory leak related to the basin map window was repaired. Changing or closing and opening a large number basin maps could previously result in an OutOfMemory error.
Renaming Control Specifications
The right-click option to rename control specifications would fail to rename the control specification, instead taking on a default value. This problem has been repaired.
Saving Kinematic Wave Transform Parameters
In some situations, Kinematic Wave Transform parameters were not being saved to the basin model from the global editor. Both the global and component editors now save changes to the parameters.
Forecast Blending when Observed Data Is Missing
Previously, when a forecast alternative was computed and 1) missing data was encountered at the start of the simulation for the junction(s) in question and 2) no allowed missing percentage (or an allowed missing percentage greater than 50%) was specified within the blending editor, no blending was actually performed. Blending will now occur if missing data is encountered at the start of the simulation but the amount of observed data is still less than or equal to the specified allowed missing percentage.
NegativeArraySizeException in Kinematic Wave Channel Routing
A warning message was added when the free water surface assumption is violated in a circular cross section in the Kinematic Wave routing method, instead of halting the simulation with an exception.
Error 10000 when Adding New Precipitation Gage
A bug was fixed where an Error 10000 was thrown when attempting to add a new precipitation gage in a project that used hypothetical storm precipitation in the met model.
Documentation
The Hydrologic Modeling System HEC-HMS: Quick Start Guide (Version 4.4 March 2020) provides a brief description of the program for new users. It describes the different parts of the interface and the basic steps necessary to obtain simulation results. A tutorial takes the user through the creation of a new project and shows how to obtain results.
The Hydrologic Modeling System HEC-HMS: User's Manual (Version 4.4 March 2020) contains extensive information on installing and using the program. Details on the use of each of the features and capabilities in the program are included. The manual has been updated with information describing new features added to the program for this Version 4.4 release.
The Hydrologic Modeling System HEC-HMS: Validation Guide (Version 4.3 August 2018) contains information on the procedures used to certify the software for release. The manual describes the tests that have been established and the procedures used for determining the correct result for each test. An accompanying data kit includes all of the project data necessary to replicate the tests performed at HEC prior to certifying a new release for distribution.
The Hydrologic Modeling System HEC-HMS: Applications Guide (March 2015) illustrates how to apply the program in a variety of different studies. Data requirements, calibration procedures, and typical results presentation styles are provided for studies ranging from flood risk management to sediment yield.
The Hydrologic Modeling System HEC-HMS: Technical Reference Manual (March 2000) continues to accurately describe the mathematical models included in the program. New simulation capabilities have been added to the program and are not included in the manual. The manual is currently undergoing a major revision to expand documentation of existing mathematical models and fully describe the newly added models.
Support Policy
Technical support for program users within the U.S. Army Corps of Engineers is provided through an annual subscription service. Subscribing offices can expect full support from HEC staff in the routine application of the program. Users are strongly urged to consult with HEC staff on the technical feasibility of using the program before beginning a project with unique requirements such as grid cell hydrology, snow melt, continuous simulation, sediment transport, or water quality. Special guidance is also available for the development of models for flow forecasting. Extended support for large or complex projects can be arranged under a separate reimbursable project agreement.
Support cannot be provided to users outside the U.S. Army Corps of Engineers. Several companies and organizations offer varying levels of support, some through a fee-for-service support similar to the support provided to subscribing Corps offices. Such service agreements are between the user and the vendor and do not include HEC staff. Vendors can be located through internet searches.
Reporting of suspected program errors is unrestricted and we will reply to all correspondence concerning such errors. We are continuously working to improve the program and possible bugs should always be reported. Reports should include a written description of the steps that lead to the problem and the effects that result from it. If we cannot reproduce the reported problem, we may ask you to send a copy of your project.
Request support or report program errors through the following channels:
- Visit our web site at http://www.hec.usace.army.mil.
- Send email to hms@usace.army.mil.
- Call +1.530.756.1104, 7:30 am to 4:30 pm Pacific Time Monday through Friday.