Hydrologic Sampling Editor Interface
Overview
The Hydrologic Sampling Editor allows the user to apply one of the three available hydrologic sampling methods (review Overview of Sampling Methods) per hydrologic sampling alternative (review Create a Hydrologic Sampling Alternative) for use in the Hydrologic Engineering Center's Watershed Analysis Tool (HEC-WAT) Flood Risk Analysis (FRA) simulation (review the HEC-WAT User Manual available here: HEC-WAT Documentation). The Hydrologic Sampling Editor provides the ability for the user to define what type of Data to be Sampled and Sampling Method, and responds by changing components of the Hydrologic Sampling Editor to match the methodology selected. The following subsections provide detailed descriptions of the Hydrologic Sampling Editor components.

Navigation Bar
The navigation bar (highlighted in the Hydrologic Sampler Editor image above) is located at the end of the selection box for hydrologic sampling alternatives, and provides navigation through the alternatives in the HEC-WAT project.
From left to right the navigator buttons are:
- First Record button – moves directly to the top alternative in the list of alternatives.
- Previous Record button – moves forward through the list one alternative at a time.
- Next Record button – moves backward through the list one alternative at a time.
- Last Record button – moves directly to the bottom alternative in the list.
Note
The text at the center of the navigation button (e.g., 15 of 21), indicates the total number (e.g., 21) of hydrologic sampling alternatives that have been defined, and which hydrologic sampling alternative is currently being accessed (e.g., 15).Data and Method Selection
Data and method selection area (highlighted in the Hydrologic Sampling Editor image above) provides the ability to define what data is to be sampled (i.e., Flow Sampling, Precipitation Sampling) from Data to be Sampled list. In addition, the user can select the sampling method to be used (i.e., Correlated Flow Frequency Curves, Bootstrapping Historical/Synthetic Basin-wide Events, Basin Average Frequency Curve) from the Sampling Method list. Depending on the Data to be Sampled selection, the options listed in the Sampling Method list change. Selecting the sampling method is the first step towards defining a hydrologic sampling alternative.
Tabs
Tabs of the Hydrologic Sampling Editor (highlighted in the image above) separate the required user input for the available sampling methods in a logical and methodological order. The tabs change based on the selected sampling method and must be completed in order. To reinforce the required order of completion, some tabs are disabled until user input in a tab is completed.
Tables
The Hydrologic Sampling Editor contains several tables for viewing and entering data. Some tables are directly visible in the Hydrologic Sampling Editor, while other tables display in new dialog boxes when certain commands are selected (e.g., Define Ordinates and Tabulate, described in Primary Locations). Below is a broad overview of the tables in the Hydrologic Sampling Editor, including options when entering and editing data.
Modifiable Tables
Depending on the table, items from a shortcut menu may be available. When a table is modifiable, a shortcut menu, in general, contains the items displayed in the image above. Several of the items open dialog boxes, from which the user can complete the required information needed for the selected item. For example, the Insert Row(s) item opens the Insert Rows dialog box displayed. However, available shortcut items for modifiable tables (or sections of tables) will adjust based on the specific table.

Semi-modifiable Tables
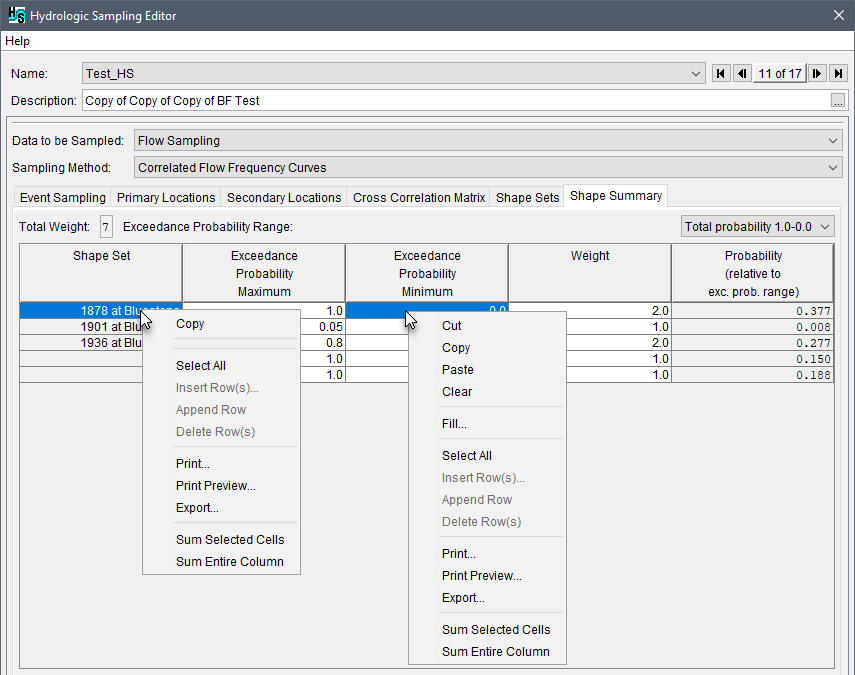
Some tables in the editor contain semi-modifiable tables. For example, the shape set summary table in the image below does not allow for inserting, appending, or deleting row(s).

In general, the user enters data manually into a table by selecting a cell (one click) and entering the value in the cell. Use the Return key to move vertically down the table, the Tab key to move horizontally across (left to right), or the Arrow keys, or place with the mouse cursor. Users can copy (Copy shortcut command or Ctrl+C) and paste values (Paste shortcut command or Ctrl+V) from an outside source, as long as the copied dataset is tab delimited.
In the Hydrologic Sampling Editor, light-gray shading, identifies non-editable tables (or sections of a table). In general, the shortcut commands for non-editable tables contain the commands displayed in the image above for the Shape Set column. Unmodifiable tables (or sections of tables) are for informative purposes only, and display values calculated or automatically populated by the hydrologic sampling process.
Plots
The Hydrologic Sampling Editor contains several plots for viewing entered data or resulting relationships. All plots contained in the Hydrologic Sampling Editor can be presented in a new dialog box by either:
- Double-clicking inside a plot.
- By selecting the Plot button where provided.

Plot Dialog Menus
This information describes generic menu items contained in plot dialog boxes in the Hydrologic Sampling Editor. The plot dialog box includes three menus: File, Edit and View.
Plot - File Menu
The File menu allows users to tabulate plotted data, save the plot, and print or close a plot dialog box. Available commands: Save As, Save Template, Apply Template, Save Specification, Print, Page Setup, Print Preview, Print Multiple, and Close.
Plot - Edit Menu
The Edit menu allows users to modify the properties of a plot, configure the layout of a plot, and modify default settings. Available commands: Plot Properties, Configure Plot Layout, Default Line Styles, and Default Plot Properties.
Plot - View Menu
The View menu allows users to change the view for a plot, and the legend placement and or presence in a plot. Available commands: Always On Top, Use Line Styles (default), Zoom to all, Legend Placement (Bottom of Panel, Right of Panel, Separate Window, Viewport Upper Left, or Viewport Upper Right), and Show Legend.
Known Issue
Displaying the legend on this plot is not working with the current HEC-WAT 1.1 Hydrologic Sampler plug-in. This will be fixed in a future HEC-WAT version.
DSS Time Series Panel
In order for a hydrologic sampling alternative to work in an HEC-WAT study, DSS time series dataset(s) of either flow hydrographs or precipitation hyetographs must be defined in the Hydrologic Sampling Editor. For example, the Flow Sampling, Correlated Flow Frequency Curves, Shape Sets tab includes a DSS time series panel in the Hydrologic Sampling Editor.

The DSS time series panel allows the user to define DSS time series of data, and depending on the data and method selected (refer to Overview of Sampling Methods) the following user inputs require DSS time series records:
- Shape Sets: hydrograph or hyetograph (see Hydrographs to Scale (Shape Sets) or Hyetographs to Scale (Shape Sets), respectively), and
- Hydrographs and Forecasts: historic and/or synthetic (see Adding the Historical Record and/or Defining Synthetic Events, respectively).
The standard DSS time series panel consists of a DSS input table that contains seven columns: Location, Type, DSS File, and Part A, Part B, Part C, Part E, and Part F. The Hydrologic Sampling Editor will automatically populate the information displayed in the Location column based on previously entered user inputs. The users must complete the remaining columns in the DSS input table. Incomplete DSS input tables can result in data consistency error(s) (refer to the Data Check section). Instructions for completing the DSS input table is provided in the method specific chapters (review the Overview of Sampling Methods, Table 1).
The Plot and Tabulate buttons in the DSS time series panel can be used to view (plot, tabular) assigned DSS time series for a selected Location. The Select DSS Path button is used to assign a DSS time series record to a selected location.
Data Check
The Hydrologic Sampling Editor provides a data check can be performed to search for data consistency errors in the current hydrologic sampling alternative at any time. The data check option should generally be used after all required inputs have been defined to avoid generating a long list of as-yet undefined inputs.
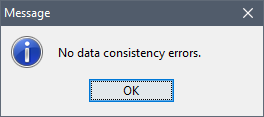
To perform a data check, click Data Check in the Hydrologic Sampler Editor, if no issues are experienced a message window opens letting the user know that no data consistency errors were found.

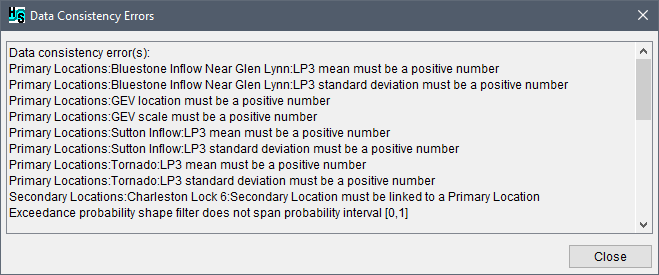
If user input is missing, incomplete or inconsistent, a Data Consistency Errors message window opens providing a list of all of the identifiable "Data consistency error(s)" for the selected hydrologic sampling alternative.

The Data Consistency Errors message window displays the name of the Hydrologic Sampling Editor tab (e.g., Primary Locations and Shape Sets tabs) when an issue with the hydrologic sampling data is found. The error report also provides the specific Location (e.g., Bluestone Inflow Near Glen Lynn), and the user input (e.g., LP3 mean must be a positive number) when data needs to be corrected or added.
Standard Buttons
Three standard buttons (OK, Cancel, Apply) are located at the bottom of the Hydrologic Sampling Editor. The standard buttons allow users to click OK to save edits and close the editor/dialog box; click Cancel to close the editor/dialog box without saving edits; or, click Apply to save changes without closing the editor/dialog box.
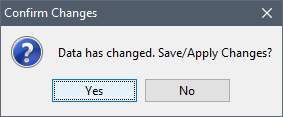
In general, it is a good practice to click Apply to save (to disk) modifications made before switching between tabs or between hydrologic sampling alternatives. However, the Hydrologic Sampling Editor automatically retains modifications (in memory) when switching between tabs until Apply or OK is clicked to save changes to disk. When editing several hydrologic sampling alternatives, click Apply to save changes to the current hydrologic sampling alternative before navigating to the next hydrologic sampling alternative. If the user does not save edits when editing several hydrologic sampling alternatives, a Confirm Changes dialog opens, asking the user if they want to save the edits of the hydrologic sampling alternative that was being edited.
