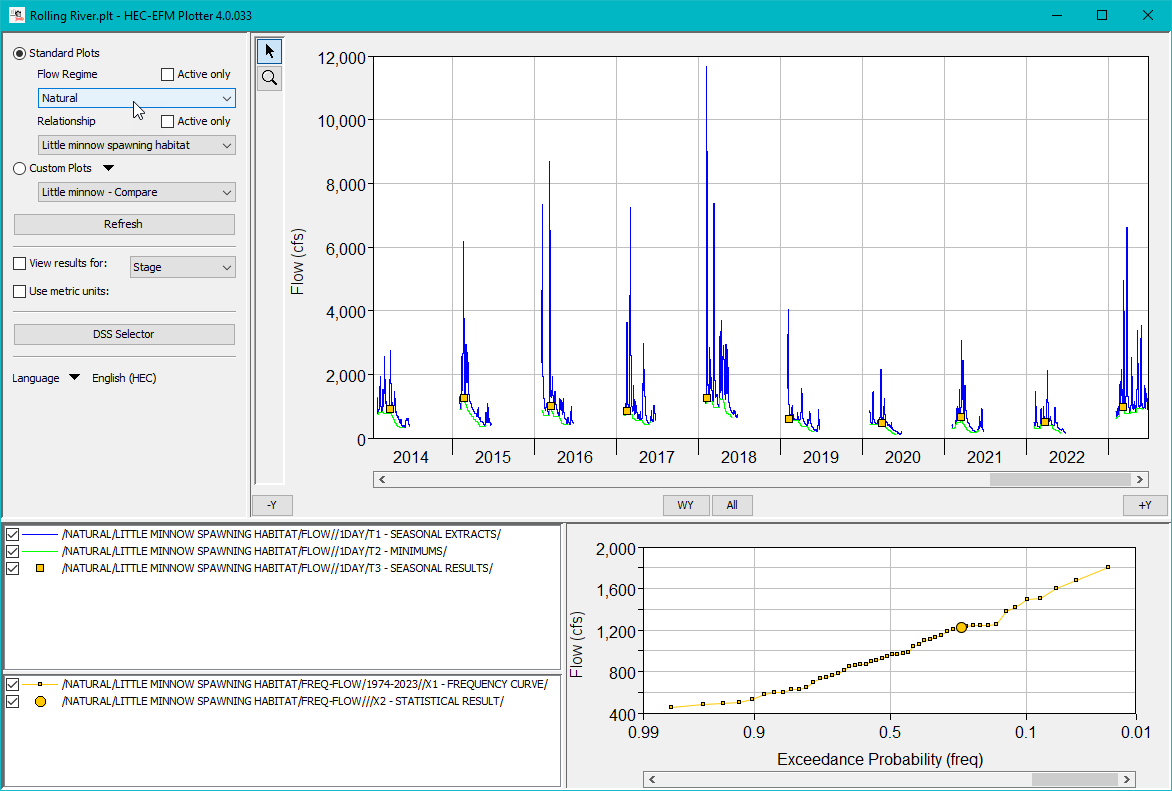
HEC-EFM Plotter is designed to help users view, navigate, and interpret output generated by HEC-EFM. Available outputs are automatically imported as a series of "Standard Plots" for the flow regimes and
relationships being analyzed in HEC-EFM. HEC-EFM Plotter only imports HEC-EFM outputs that are written to HEC-DSS; Output settings are managed in HEC-EFM.
"Custom Plots" can be added to compare results for multiple relationships or flow regimes.
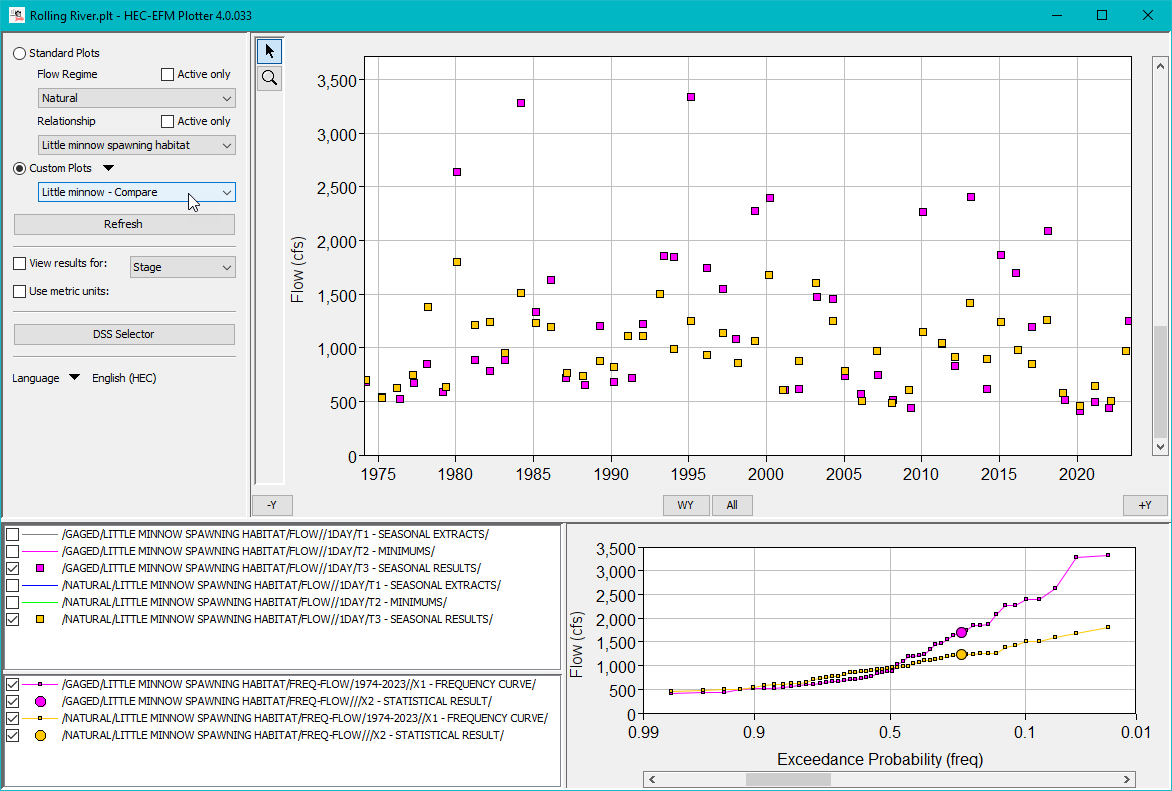
By displaying each computational step HEC-EFM performs while analyzing time series, HEC-EFM Plotter offers an opportunity to understand the statistical processes being used by HEC-EFM and provides a way for
teams to interactively explore and refine the statistical settings being used to define relationships between hydrology and ecology.