HEC-GridUtil is designed to provide viewing, processing, and analysis capabilities for gridded data sets stored in HEC-DSS format (Hydrologic Engineering Center's Data Storage System). Gridded data may be
contained in either a Single Grid or a Grid Set.
A Single Grid consists of a single layer, instance, or time interval of gridded data. Examples of Single Grids include impervious surface data and topographic data, which may be considered constant over long
periods of time. However, data recorded at a single time interval, such as precipitation or temperature data derived from a single remotely sensed image can also be represented by Single Grids. A Single Grid
can be displayed simultaneously along with a Grid Set.
Grid Sets contain time series of two-dimensional gridded data. Each record in a Grid Set contains a grid of values, and each record is defined by a separate DSS path name. The data can either be instantaneous
values recorded at a particular time, e.g., air temperature, or data recorded or averaged over a time interval, e.g., hourly averages of precipitation. Grid Sets can represent time series of Single Grids, where
the value of each grid cell may vary during the time window. The following is a description of the major capabilities of HEC-GridUtil.
The user interacts with HEC-GridUtil through a graphical user interface (GUI). The main focus in the design of the interface was to make it easy to use the software, while still maintaining a high level of
efficiency for the user. The interface provides for the following functions:
Graphical Display of Spatial Data
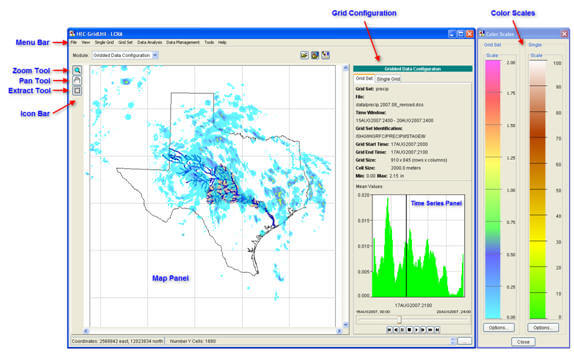
Graphics include a map panel, grid configuration panel, message panel, time series panel, and a color scale window. The Map Panel displays the gridded data and optional reference layers.
Whenever the pointer enters the Map Panel, the lower left corner of the interface displays the coordinates of the pointer. The grid configuration panel becomes active when a gridded data
set is loaded. This panel describes the data set's defining characteristics. The message panel displays information as GridUtil runs, such as certain file accesses or accuracy of coordinate
system transformations. The time series panel displays time series of the mean, minimum, or maximum averages of a Grid Set. The controls at the bottom of this panel allow playing, pausing,
stopping, and skipping through the gridded data. The black vertical line on the time series plot and the date and time immediately below this plot indicate the time for which gridded data
will be displayed in the map window. The starting and ending times of the selected time window are shown above the horizontal slider bar. The slider control can be dragged to quickly scan
through the gridded data set. The color scale window shows color scales for loaded grid sets and single grids. Vector, point, and raster data may be loaded as separate layers. These features
can be enhanced by adjusting their color, line style, transparency, data labels, and other features.
Back to the top
File Management
Gridded data may be loaded from an existing DSS file or imported from a number of formats, including ArcInfo ASCII grids, XMRG, and NetCDF. Gridded data may be exported to ArcInfo ASCII
grid format. HEC-GridUtil provides functions to access basic metadata, import/export gridded data, save imported or processed grids, and delete gridded data.
Back to the top
Data Analysis
The Data Analysis menu contains options for time series operations and computation of the mean areal value. Time series functions include accumulation, range, maximum, minimum, and mean.
A single value can be computed for the entire time window, or a time series may be computed for a selected time interval. HEC-GridUtil can compute time series of the mean areal value for
multiple sub-basins, over a specified time window.
Back to the top
Data Management
The Data Management menu contains options to produce a mosaic of two or more Grid Sets, extract sub-regions from a Grid Set, and to convert HRAP grids to SHG format.
Back to the top