HEC-MetVue is designed to perform temporal and spatial aggregation of meteorological datasets and performs areal average computations using input polygon shapefiles. HEC-MetVue provides tools for animating
datasets, trimming spatial extents of datasets, applying spatial translations and rotations to datasets, and applying temporal shifts to datasets. The following is a description of the major capabilities of
HEC-MetVue.
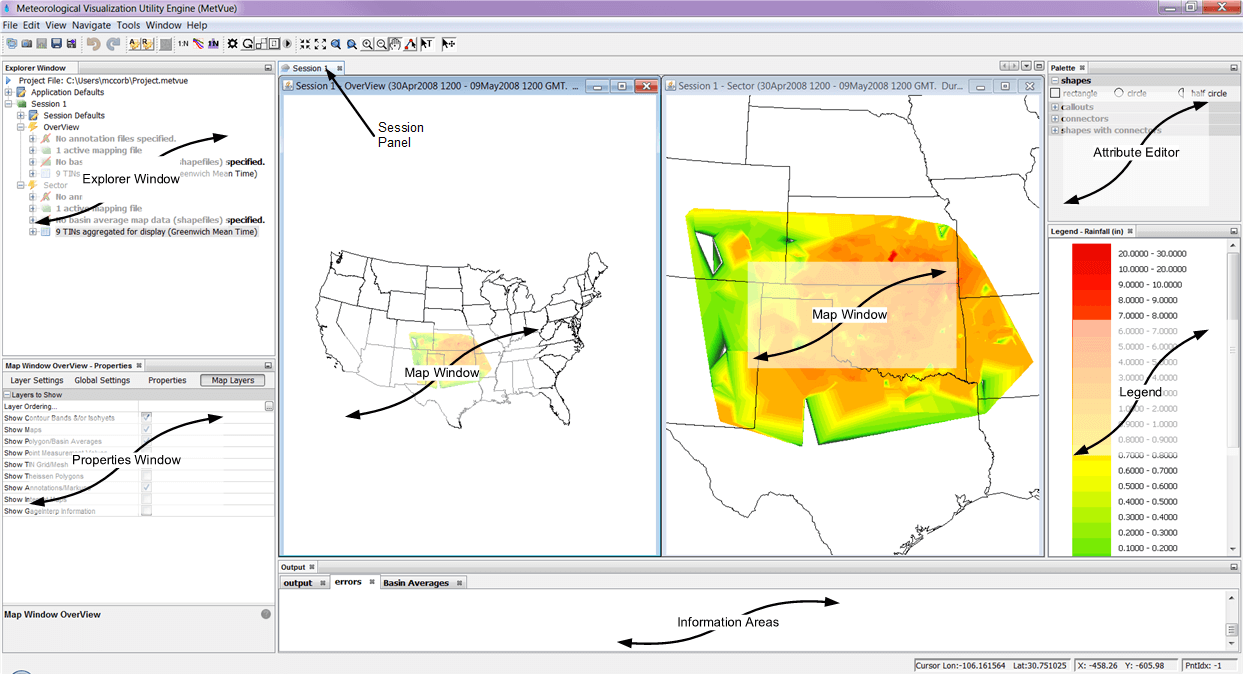
HEC-MetVue is a Java program built in the NetBeans Platform. The user interacts with HEC-MetVue through a graphical user interface (GUI). The main focus in the design of the interface was to make it easy to use
the software, while still maintaining a high level of efficiency for the user. The program’s GUI consist of a project explorer window, map windows, legend panel, properties and output panels, and a variety of
tools. The interface provides for the following functions:
- File Management
- Data Entry and Editing
- Drag and Drop Customization of the GUI components
- Map Window Tiling and Zoom Options
- Map Layering Options
Back to the top
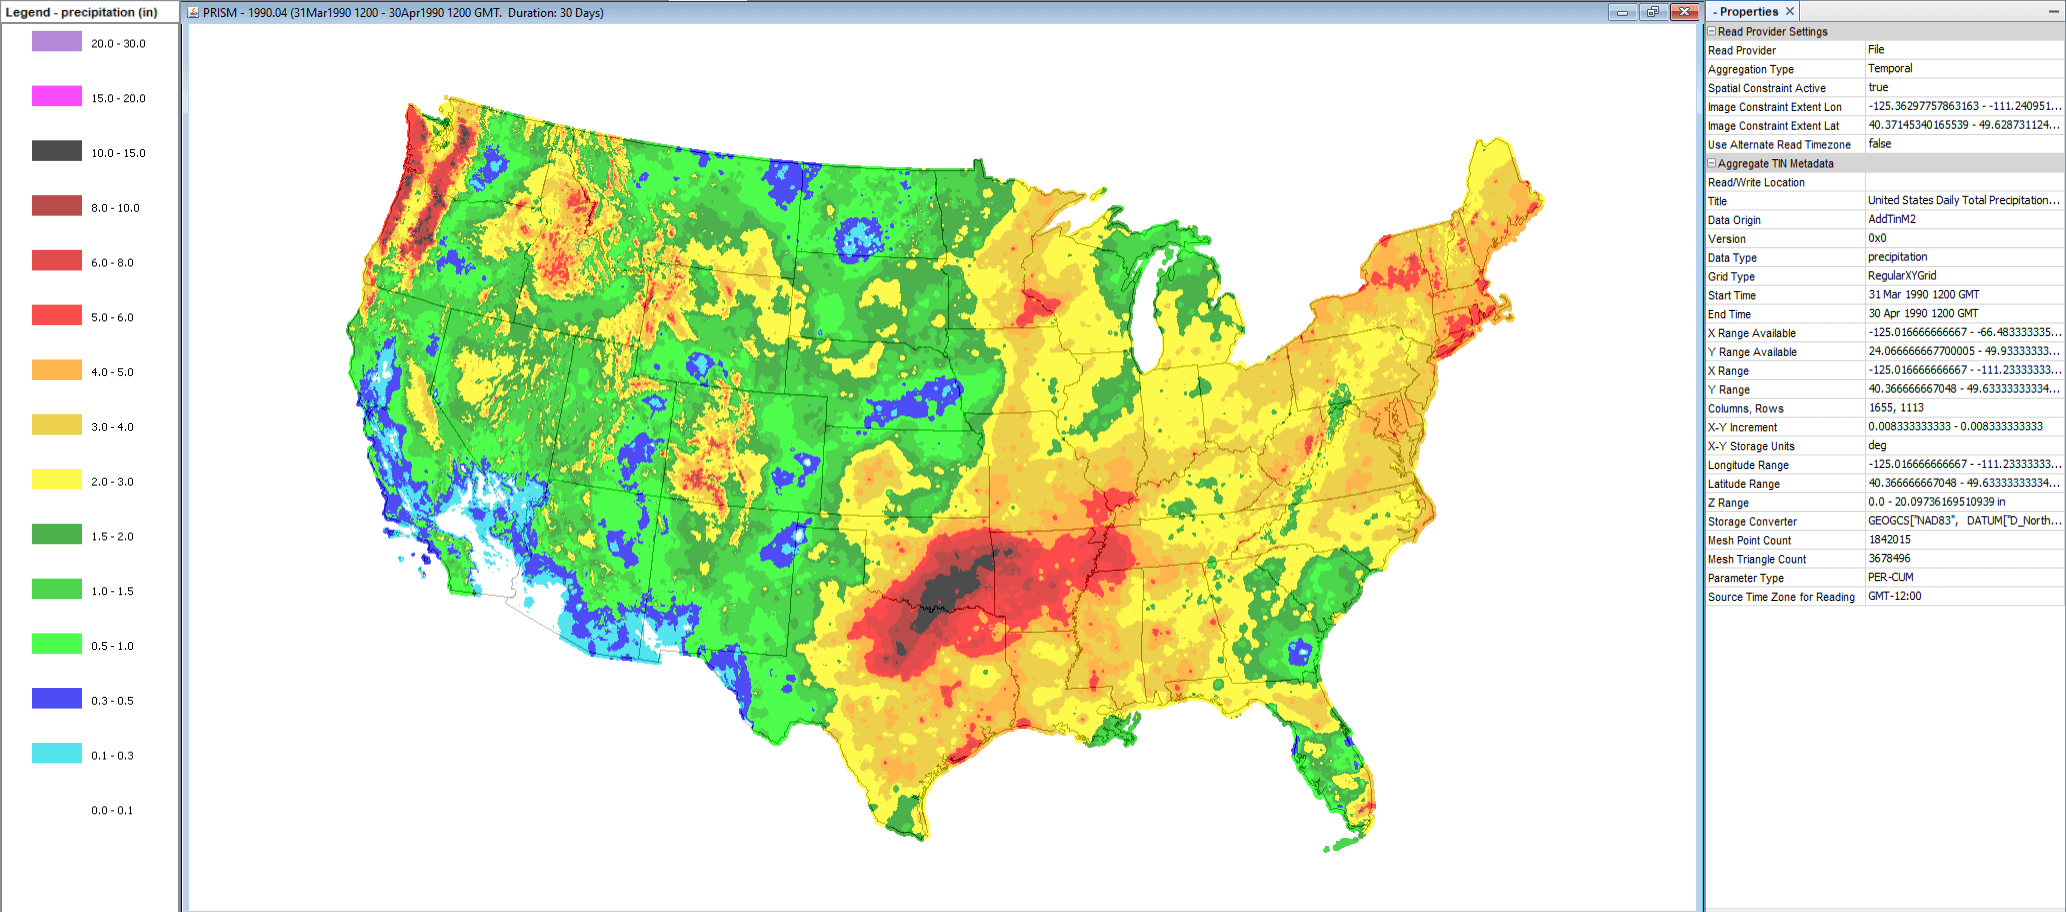
HEC-MetVue currently supports reading particular data products with formats that include: HEC-DSS, PRISM, XMRG, ESRI ASCII Grid with sidecar metadata and projection files as specified in the HEC-MetVue user’s
manual, GRIB for specific products from the National Weather Service, and NetCDF based on Climate Forecast (CF) metadata conventions. Primary output formats that HEC-MetVue currently supports are HEC-DSS and
ESRI GRID ASCII and Binary Format.
Back to the top
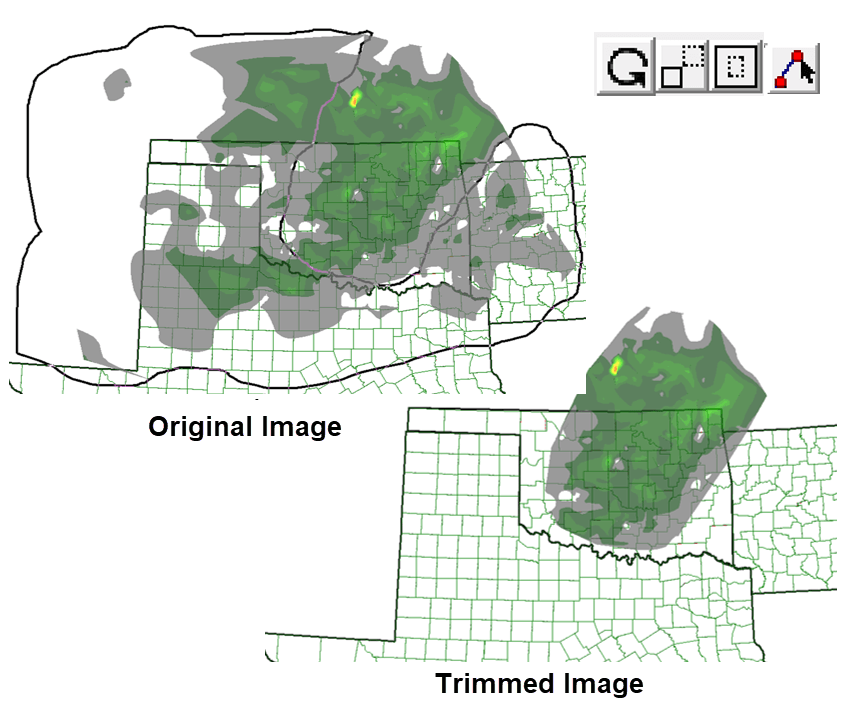
HEC-MetVue provides a variety of TIN image editing tools, including: the rotation tool for changing the image orientation, the translation tool for changing the image spatial location, the scaling tool for
resizing the image, and the trimming tool for image extents trimming. HEC-MetVue also allows for adding and deleting TIN points, modifying an individual TIN point measurement value, and modifying all the
measurement values in the TIN image by applying a global adjustment.
Back to the top
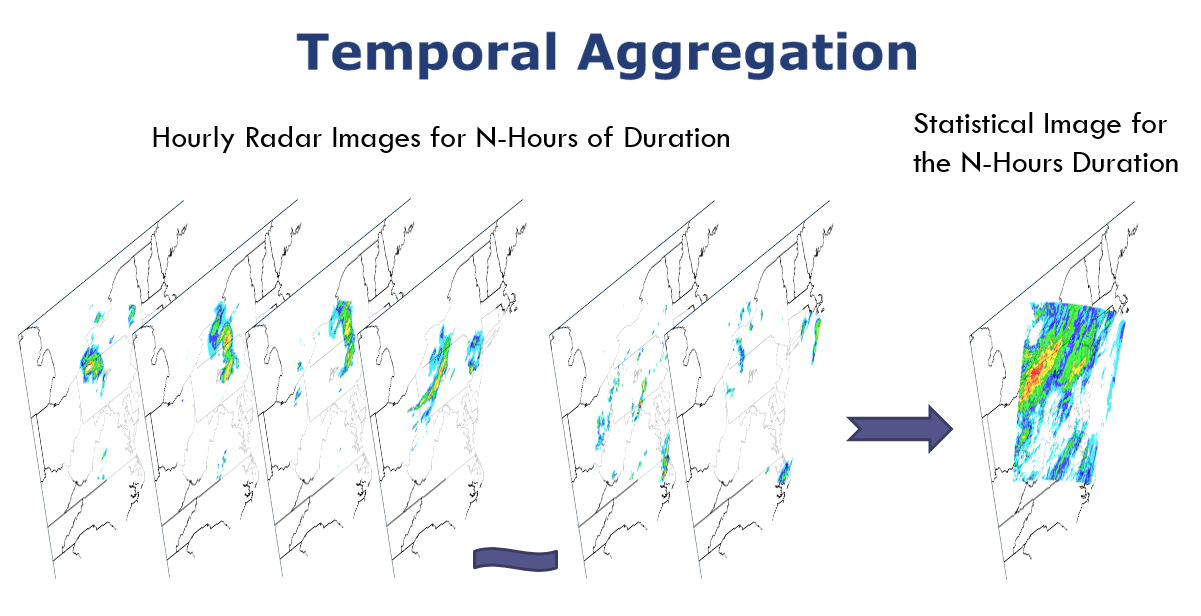
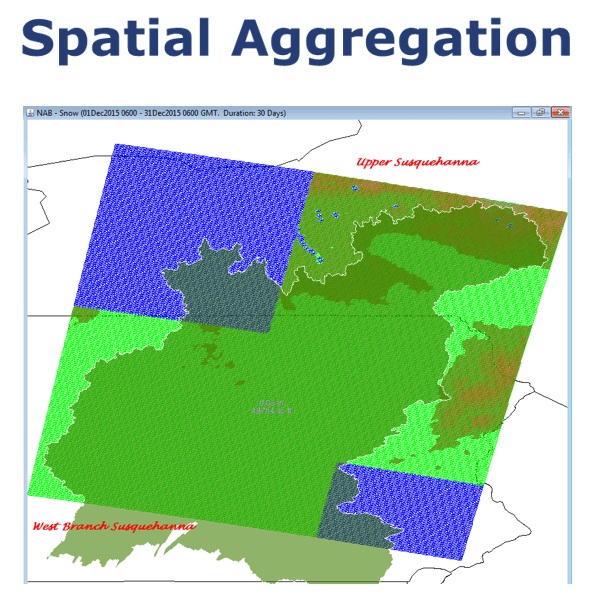
Reading multiple images, HEC-MetVue allows for the aggregation of those images temporally and spatially. By default for spatial aggregation, HEC-MetVue averages the values in the overlapping areas of the images.
But, through command line operations, other options are available to select either the maximum or minimum values when merging overlapping areas.
Back to the top
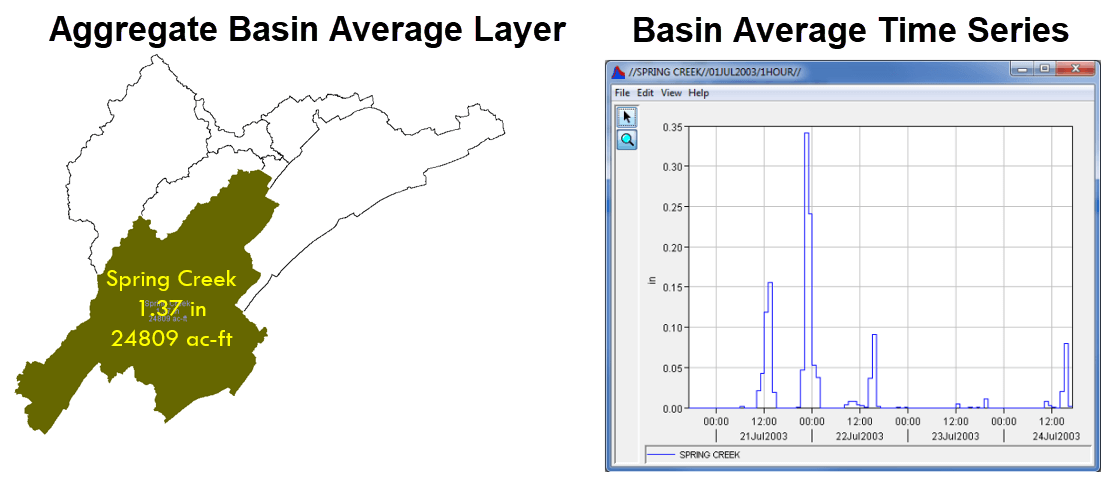
When loading input datasets and polygon shapefiles, HEC-MetVue automatically computes and displays an aggregate basin average layer, outputs an aggregate basin average summary text report to console, and allows
for writing out basin average time series to an HEC-DSS output file. Aggregate basin averages are determined based on the given volume over the timespan of the input dataset and interested area(s) of any given
shapefile(s) of interest. Currently, the aggregate image statistics computed by HEC-MetVue are only aggregate basin averages, which are mainly applicable for datasets with depth measurement such as
precipitation. However, turning off the automatically computed aggregate basin average layer and writing out basin average time series can still be useful for non-precipitation datasets such as temperature.
Back to the top
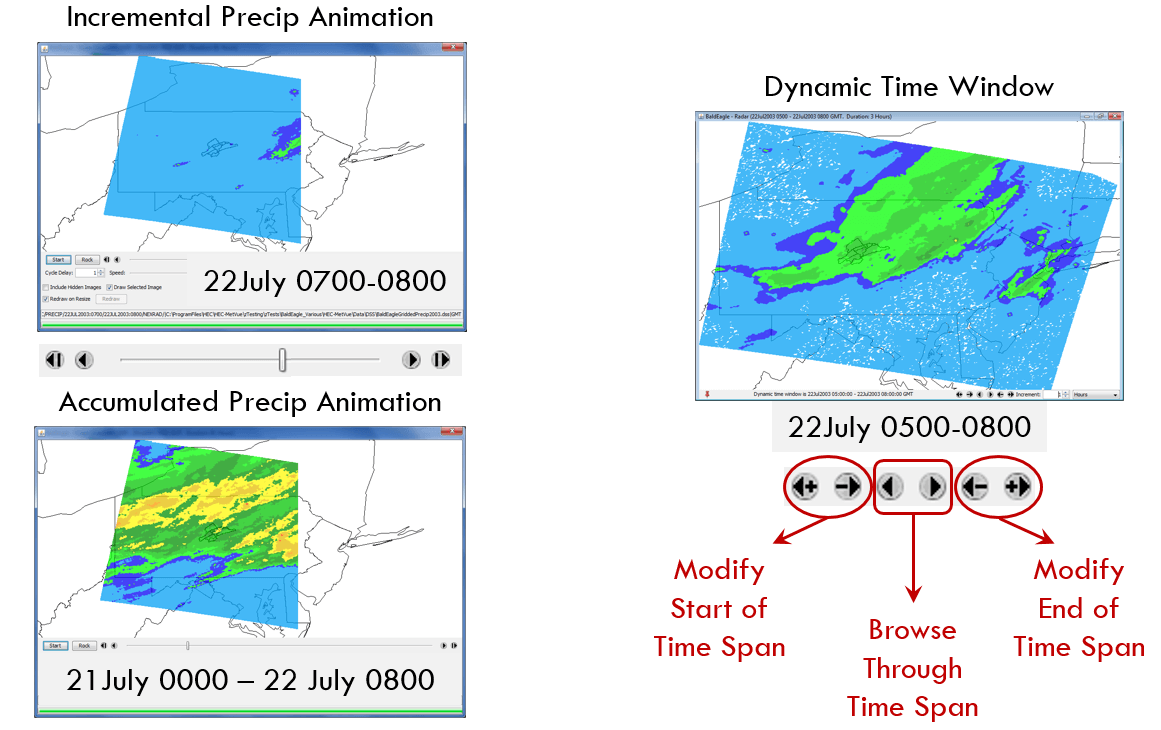
The Animation tool  in HEC-MetVue provides two options: animation of an incremental sequence or animation of an accumulated sequence. In
addition, the HEC-MetVue Map Windows have a built-in Dynamic Time Widow feature that allows for scanning through a multi-image dataset over an adjustable and moving time span.
in HEC-MetVue provides two options: animation of an incremental sequence or animation of an accumulated sequence. In
addition, the HEC-MetVue Map Windows have a built-in Dynamic Time Widow feature that allows for scanning through a multi-image dataset over an adjustable and moving time span.
Back to the top
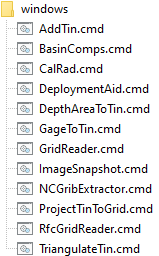
A number of HEC-MetVue operations can be automated, including:
- Reading supported product formats
- Converting data formats
- Shifting datasets in time and changing time zones
- Clipping data extents
- Reprojecting TIN or Grid images
- Combining datasets
- Computing areal statistics
- Generating TINs or Grids through spatial interpolation of georeferenced point measurements
Template batch scripts are available within the HEC-MetVue install package.
Back to the top