Hydrologic Sampler Results
In HEC-WAT, certain Hydrologic Sampler results are available for Flood Risk Analysis (FRA) computes within the HEC-WAT Framework. Results can be accessed using two methods: viewing Hydrologic Sampler Results menu items (accessed from the HEC-WAT menu bar); and using the more generalized Output Variable Editor (accessed from the HEC-WAT toolbar), described in the HEC-WAT User Manual available here: HEC-WAT Documentation.
The Hydrologic Sampler Results menu items will only provide results if the Hydrologic Sampler output files are saved for each lifecycle and event. Certain results require all lifecycle DSS files to be saved as well (review Prerequisites, Overview section). Although the Results menu items are limited to flow sampling results, the Output Variable Editor can provide Hydrologic Sampler output both flow and precipitation sampling results (Table 1).
Selected Method | Output Variable(s) |
|---|---|
Flow Sampling | Primary and Secondary locations: MAX FLOW, PEAK FLOW MAX, and any user added flow (e.g., AVG 3 DAY MAX) |
Flow Sampling | Hydrograph locations (Flow) and Forecast locations (Stor) |
Precipitation Sampling | Hyetograph locations (Precip) |
This section describes the six standard Hydrologic Sampler Results menu options provided by the HEC-WAT Framework:
- Plot Hydrograph: displays individual event hydrographs generated by the Hydrologic Sampler.
- Plot Event Distribution: provides a histogram of the dates of sampled flood events, compared to the defined flood season distribution.
- Plot Maximum Flows: displays the frequency curve of sampled flows for each realization compared to the defined frequency curves, at specified locations.
- Correlation Table: provides the computed correlation of base 10 logs of flow sampled, compared to the defined correlations.
- Plot Shape Set Frequency: displays the histogram of sampled shape sets, compared to defined relative probabilities (based on weights and exceedance probability range) for each.
- Output Report: contains values for event date, shape set, and flood flow magnitudes randomly sampled for each event at each location for each lifecycle.
All six items are available for the Flow Sampling – Correlated Frequency Curves method, while only two of the items are available for the Flow Sampling – Bootstrapping Historical/Synthetic Basin-wide Events method (Plot Hydrograph and Output Report).
Plot Hydrograph
The Plot Hydrograph option plots an individual hydrograph generated by the Hydrologic Sampler within an FRA study. This results option is available for both the Flow Sampling – Correlated Frequency Curves method and the Flow Sampling – Bootstrapping Historical/Synthetic Basin-wide Events method. Open the plot hydrograph simulation results:
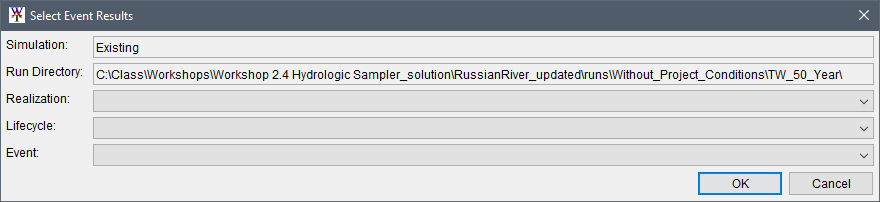
- Utilize one of the methods provided in Accessing Results to access the results options for the Hydrologic Sampling alternative of interest. Then select the Plot Hydrograph option from the Hydrologic Sampling submenu, and the Select Event Results dialog box opens, if the results have not been selected already. If necessary, use the lists to select the Realization, Lifecycle, and Event of interest in the Select Event Results dialog box. Then click OK to close the Select Event Results dialog box.
- An HEC-WAT Progress window opens displaying the "Building Plot" progress. Once HEC-WAT has completed building the plot, the progress window closes and the Plot Hydrograph window opens.

- Note, the Plot Hydrographs window has lists for: Realization, Lifecycle, Event, and Location. Users can utilize the first three dropdown lists to change the selected the realization, lifecycle and/or event (previously selected from the Select Event Results dialog box). The last dropdown list is for changing the hydrograph plot Location (e.g., Bluestone Inflow Near Glen Lynn). The Hydrographs plot automatically updates when one of these selections is modified.

- The Hydrologic Sampler plot window comes equipped with two tools. The first tool is the Select Tool, which allows users to right-click on the hydrograph to open the callout information box (light-gray box) and other shortcut options. The second tool is the Zoom Tool which will zoom-in (left-click and drag a box) or zoom-out (right-click). When the Select Tool is active and users hover over graph elements a tooltip (light-yellow box) is displayed.

- The callout plot shortcut options are:
- Edit Properties – This option opens the Properties box, which allows users to modify the color, style, weight, and other graphical properties. Click OK to close the Properties box and update the hydrograph plot.

- Hide Curve – This option hides the selected curve from view.
- Remove Curve – This option removes the selected curve from the plot.
- Add Callout – This option opens the Add Callout dialog box, which allows users to manually enter information to add to the plot in a callout box.

- Edit Properties – This option opens the Properties box, which allows users to modify the color, style, weight, and other graphical properties. Click OK to close the Properties box and update the hydrograph plot.
- When finished reviewing the plot, close the plot window by clicking the window close button.
Plot Event Distribution
The Plot Event Distribution option plots a histogram of the event dates of all sampled floods generated by the Hydrologic Sampler within an FRA study. Each sampled date is used to place the peak of the flood event hydrograph in time, on a month and day. This results option is only available for the Correlated Flow Frequency Sampling method because the Bootstrap Sampling with Historical and Pre-scaled Synthetic Events method leaves events on the month and day they historically occurred.
Open the plot of the event-date distribution simulation results:
- Utilize one of the methods provided in Accessing Results to access the Hydrologic Sampler results options for the Hydrologic Sampling alternative of interest (e.g., FullSampling). Then select the Plot Event Distribution option from the Hydrologic Sampling submenu, and the Select Event Results dialog box opens, if the results have not been selected already.
If necessary, use the lists to select the Realization, Lifecycle, and Event of interest in the Select Event Results dialog box. Then click OK to close the Select Event Results dialog box.
- An HEC-WAT Progress window opens displaying the "Building Plot" progress, and the Flood Season plot window opens.

- The Flood Season plot window displays the user-defined probability distribution function (PDF) in blue and the histogram of simulation results from the compute in red. The more events computed in the simulation, the closer these curves should match. While the user-defined distribution is generally continuous (unless the selection was for empirical (graphical) distribution), the PDF is discretized to plot with the results histogram. Refer to Defining Flow Frequency Sampling Season and Defining Precipitation Sampling Season for more information regarding Event Sampling.
- As explained in the Plot Hydrograph section, the Hydrologic Sampler plot windows have two tools. The first tool being the Select Tool, which allows users to right-click on the hydrograph to open the callout information box and other shortcut options. The second tool is the Zoom Tool will zoom-in (left-click and drag a box) or zoom-out (right-click).
- When finished reviewing the plot, close the plot window by clicking the window close button.
Plot Maximum Flows
The Plot Maximum Flow option creates a frequency plot of the sampled maximum flow of all flood events at each primary location generated by the Hydrologic Sampler within an FRA study. A peak flow magnitude is generated for every event at each primary location based on correlated sampling from all locations' user-defined frequency curves. The results of this sampling are compared to the user-defined curve on a frequency plot. This results option is only available for the Flow Sampling – Correlated Frequency Curves sampling method.
Open the plot maximum flows simulation results:
- Utilize one of the methods provided in Accessing Results to access the Hydrologic Sampler results options for the Hydrologic Sampling alternative of interest (e.g., FullSampling). Then select the Plot Maximum Flows option from the Hydrologic Sampling submenu, and the Select Event Results dialog box opens, if the results have not been selected already.
If necessary, use the lists to select the Realization, Lifecycle, and Event of interest in the Select Event Results dialog box. Then click OK to close the Select Event Results dialog box. - A Progress window opens displaying the "Building Plot" progress, and the Primary Maximum Flow Frequency plot window opens.
- The Primary Maximum Flow Frequency plot window provides the User Defined and From Compute maximum flow frequency return period for the selected primary Flow Location. Select a Flow Location from the provided list. The flow frequency plot automatically updates when the Flow Location selection is set to a new location.

- Events are sampled from a different uncertainty-adjusted frequency curve in each realization, and the plot includes the events from all realizations. The maximum flow plot for a given location ranks all of the sampled flows and plots them versus an estimated exceedance probability (the Weibull plotting position), shown in red.
- The user-defined frequency curve for the specified location is shown in blue. Results from a single realization will echo the specific uncertainty-adjusted frequency curve that was sampled, while results from many realizations will more closely match the user-entered frequency curve, since they reflect a combination of many uncertainty-adjusted frequency curves.
- The Hydrologic Sampler plot windows have two tools. The first tool is the Select Tool, which allows users to right-click on the hydrograph to open the callout information box and other shortcut options. The second tool is the Zoom Tool will zoom-in (left-click and drag a box) or zoom-out (right-click).
- When finished reviewing the plot, close the plot window by clicking the window close button.
Correlation Table
The Correlation Table command is only available for Hydrologic Sampling alternatives, which applied the Flow Sampling – Correlated Frequency Curves sampling method. The Correlation Table option contains the computed correlation coefficient for every pair of primary location maximum flows. Correlation is the degree to which flow magnitudes at two locations have a linear relationship, with positive correlation if they tend to be large or small at the same time. Maximum flows for each event are generated by correlated random sampling from the frequency curves at every location, maintaining correlations entered by the user in the Correlation Matrix tab of the Hydrologic Sampling Editor.
Utilize one of the methods provided in Accessing Results to access the Hydrologic Sampler results options for the Hydrologic Sampling alternative of interest (e.g., FullSampling). Then select the Correlation Table option from the Hydrologic Sampling submenu, and the Select Event Results dialog box opens, if the results have not been selected already. If necessary, use the lists to select the Realization, Lifecycle, and Event of interest in the Select Event Results dialog box. Then click OK to close the Select Event Results dialog box. A Progress window opens displaying the "Building Plot" progress, and the Cross Correlations window opens. This window displays the correlation matrices for all computed lifecycles (e.g., 68 lifecycles) and events (e.g., 306,000 events).

The Correlations window provides three tables: User Defined, From Compute and Difference. The User Defined table provides the correlation table the user specified in the Hydrologic Sampling Editor on the Correlation Matrix tab (refer to Correlation Between Locations for more information). The From Compute table displays the correlation matrix from computed simulation results, and the Difference table displays the computed difference between the user-defined and computed correlation matrices, which allows the user to spot discrepancies. When finished reviewing the table, click the close window button to close the Correlations window.
Plot Shape Set Frequency
The Plot Shape Set Frequency option plots a histogram of the event dates of all sampled floods generated by the Hydrologic Sampler within a Flood Risk Analysis (FRA) compute. Each sampled date is used to place the peak of the flood event hydrograph in time, on a month and day. This results option is only available for the Flow Sampling – Correlated Frequency Curves sampling method.
In the Correlated Flow Frequency Curves sampling method, each sampled flood event is comprised of flood flow hydrographs at all primary and secondary locations, scaled to match maximum flow values generated for that event. The hydrographs are scaled from one of the hydrograph shape sets defined by the user on the Hydrologic Sampling Editor – Shape Sets tab (review Hydrographs to Scale (Shape Sets)), which has been randomly selected for that event. Defined shape sets can be limited for use only in a specified exceedance probability range, and are also assigned weights to define their relative likelihood among other shape sets available in that range. Across the full range of probability from 0.0 to 1.0, these limited ranges and weights result in a likelihood of each shape set being chosen (computed with the total probability theorem).
Review Limiting Shape Sets by Exceedance Probability (Shape Summary) for more information regarding that likelihood relative to a selected sub-range (e.g., 0.2-0.05). The likelihood is displayed as the blue user-defined curve on the Hydrologic Sampler Shape Set Frequency results plot. The histogram resulting from the sampled shape set for every event is displayed in red. The table at the bottom of the shape set frequency plot provides a list of the shape sets used in the sampling.

To open the Shape Set Frequency plot for simulation results:
- Utilize one of the methods provided in Accessing Results to access the Hydrologic Sampler results options for the Hydrologic Sampling alternative of interest. Then select the Plot Shape Set Freq. option from the Hydrologic Sampling submenu, and the Select Event Results dialog box opens, if the results have not been selected already. If necessary, use the lists to select the Realization, Lifecycle, and Event of interest in the Select Event Results dialog box. Then click OK to close the Select Event Results dialog box.
- An HEC-WAT Progress window opens displaying the "Building Plot" progress, and the Shape Set Frequency plot dialog box opens.
- The Hydrologic Sampler results plot windows have two tools. The first tool being the Select Tool, which allows users to right-click on the histogram to open the callout information box and other shortcut options. The second tool is the Zoom Tool will zoom-in (left-click and drag a box) or zoom-out (right-click).
- Additionally, the Shape Set Frequency plot window has a table at the bottom of the plot window providing the shape set name (e.g., Shape Set: 1987) based on the shape set index number (e.g., Label: 1). Recall that the shape set name is the name provided by the user in the Hydrologic Sampling Editor in the Shape Sets tab when the shape set was created (refer to Hydrographs to Scale (Shape Sets) and Hyetographs to Scale (Shape Sets) for more information on the Shape Sets tab).
- When finished reviewing the plot, click the window close button to close the Shape Set Frequency plot window.
Output Report
The Hydrologic Sampler Output Report is available for both the Flow Sampling – Correlated Frequency Curves sampling method and the Flow Sampling – Bootstrapping Historical/Synthetic Basin-wide Events sampling method. The Hydrologic Sampler Output Report is opened from *.hsr file is stored in the Hydrologic Sampling folder under each lifecycle folder (review Prerequisites, Overview section), and contains values for event date, shape set, and flood flow magnitudes randomly sampled for each event at each location. The *.hsr file is created at the lifecycle level because the Hydrologic Sampler generates output for an entire lifecycle at a time.

The Output Report window provides a detailed account of the Hydrologic Sampling alternative set parameters and the generated results. The Output Report opens to the lifecycle selected in the Select Event Results dialog. Use the vertical scroll bar located on the right-side of the report to view the entire report.
Open the Output Report simulation results:
Utilize one of the methods provided in Accessing Results to access the Hydrologic Sampler results options for the Hydrologic Sampling alternative of interest (e.g., DSMS-FWAC1). Then select the Output Report option from the Hydrologic Sampling submenu. If the results have not been selected already, the Select Event Results dialog box opens. If necessary, use the lists to select the Realization, Lifecycle, and Event of interest in the Select Event Results dialog box. Then click OK to close the Select Event Results dialog box.

Note
Note the tools at the top of the Output Report window, which are: the Cut tool, Copy tool, Paste tool, Find tool, and the Select Font tool.
- A Progress window opens displaying the "Building Plot" progress and the Output Report window opens in the Desktop Pane.
- To open the Output Report window outside of the HEC-WAT Desktop Pane, click the Detach Window Tool icon located in the bottom right corner of the window, and the report opens in a new window outside of the Desktop Pane.
- When finished reviewing the report, click the window close button to close the Output Report window.