HEC-EFM analyses involve: 1) statistical analyses of relationships between hydrology and ecology, 2) hydraulic modeling, and 3) use of Geographic Information Systems (GIS) to display results and other relevant
spatial data.
The main interface of HEC-EFM focuses on the first step in this process (statistical analyses). It has four tabs: Properties, Relationships, Tables, and Combo Relationships.
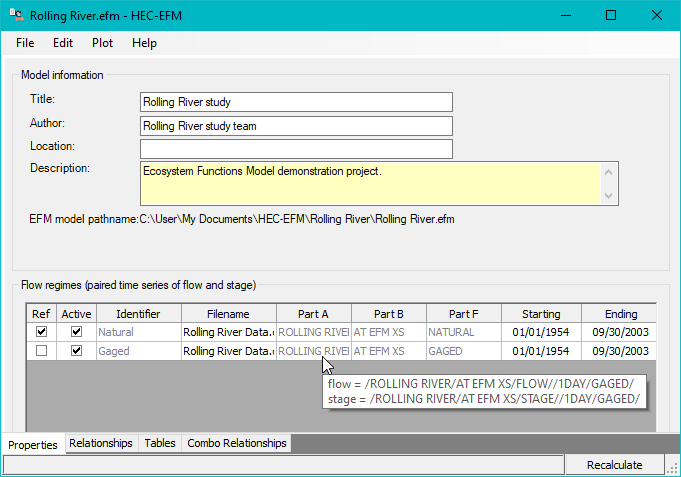
Properties Tab
The Properties Tab contains information relevant to the model as a whole and is where the user identifies the hydrologic data and time windows to be analyzed. In the figure below, there are two HEC-EFM "flow
regimes": Natural and Gaged. Each is defined by concurrent records of daily mean flow and daily mean stage data at a single location in the study area. HEC-EFM accepts input data in several text formats (i.e.,
comma, space, and tab delimited), from HDF (Hierarchical Data Format) files, and from the HEC Data Storage System (HEC-DSS).
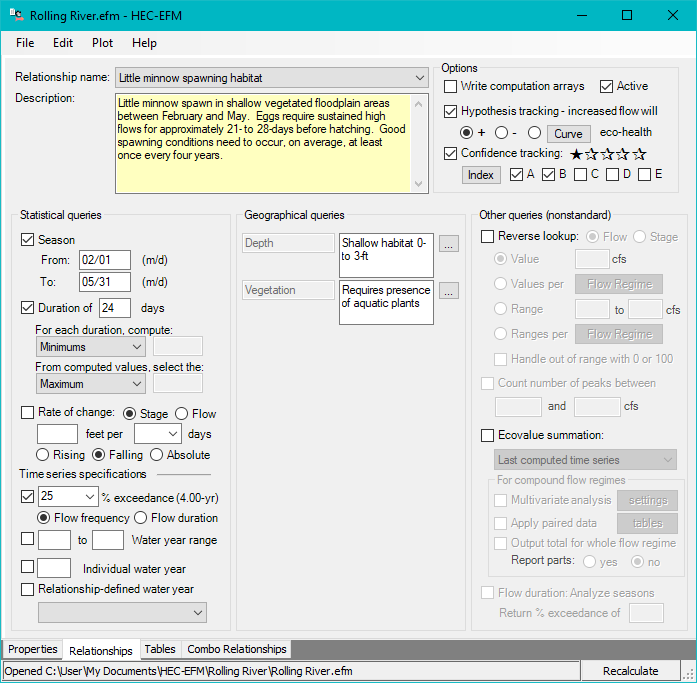
Relationships Tab
HEC-EFM "relationships" are statistical links between hydrology and ecology. Relationships are typically developed by teams of scientists and engineers using a combination of expert knowledge and scientific
literature. The Relationships Tab is where the user specifies the statistical and geographical queries that define each relationship. The figure below shows queries for the spawning season of the Little Minnow,
which is the first of six standard relationships in the HEC-EFM demonstration project (Rolling River.efm).
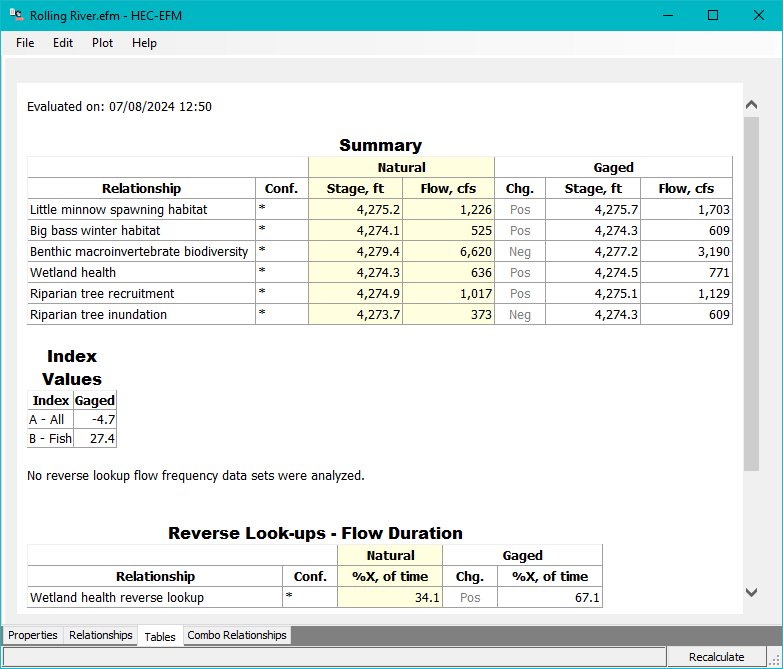
Tables Tab
The Tables Tab presents statistical results (as in figure below) for flow regime and relationships as well as project reports and output files.
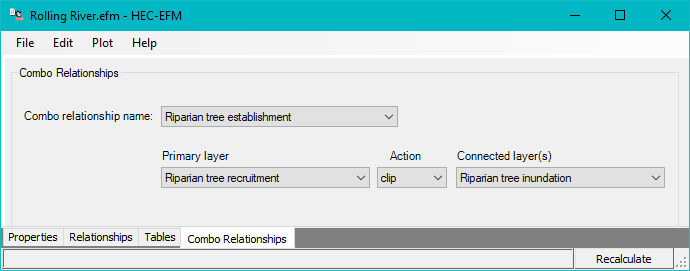
Combo Relationships Tab
Combo relationships are used to group two or more individual relationships to represent a single ecosystem dynamic. In the figure below, Riparian tree establishment is defined as Riparian tree recruitment minus
Riparian tree inundation.
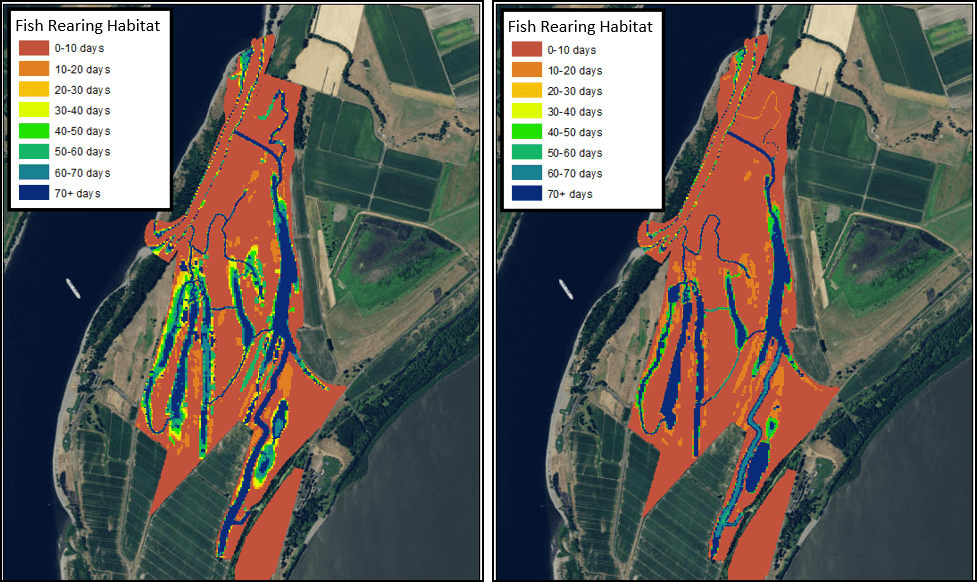
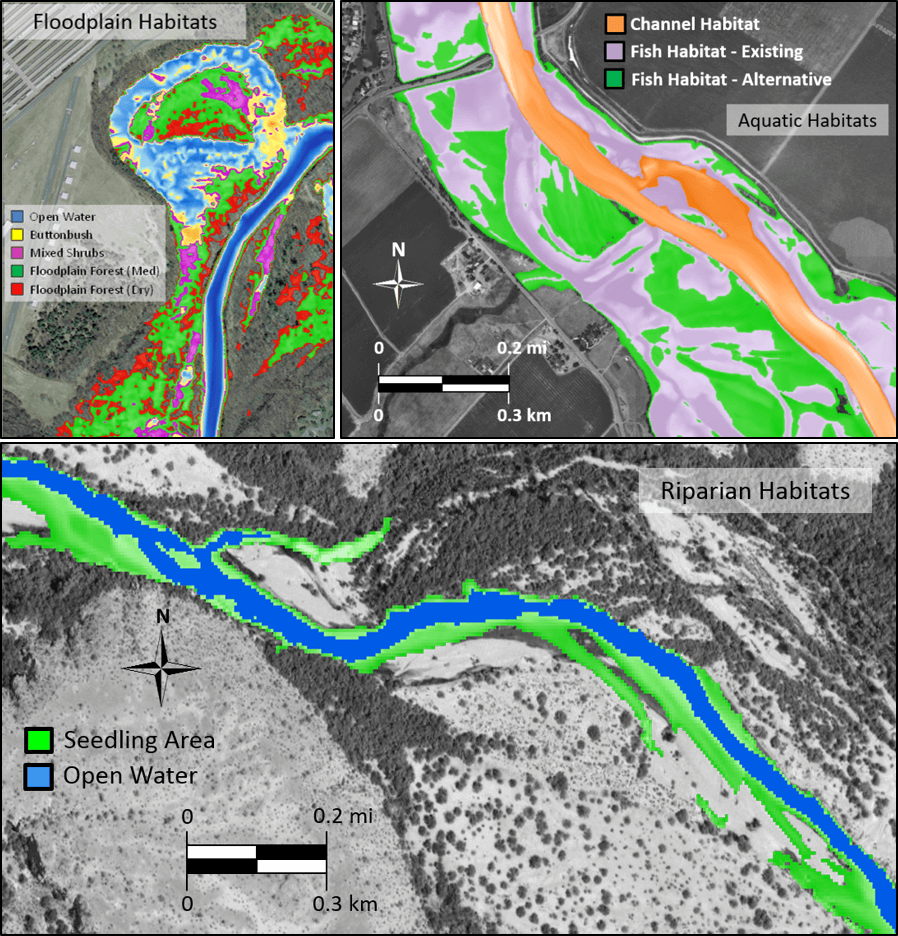
Hydraulic Modeling and Use of GIS
Statistical results computed by HEC-EFM are translated to water surface profiles, water depths, and water velocities by hydraulic modeling packages like HEC-RAS and HEC-GeoRAS. These data can be viewed in GIS and
overlaid with other spatial data sets that have ecological significance (land use, soils, and vegetation mapping) to gain more insight about important ecosystem dynamics. The figure below, also shows spatial
results for Floodplain, Aquatic, and Riparian Habitats. All were generated via the HEC-EFM process of statistical analyses, hydraulic modeling, and use of GIS.
Use of Two-Dimensional Hydraulic Modeling Output
HEC-EFM can import time series data that are stored in the Hierarchical Data Format (HDF) for use as flow regimes. HDF is a frequently used database format employed by multiple HEC software to store model
simulation outputs. The HEC-EFM process is unchanged. Ecological relationships are queried for each flow regime, though, with two-dimensional data, there are time series data for each element in each
two-dimensional area (see figure below).
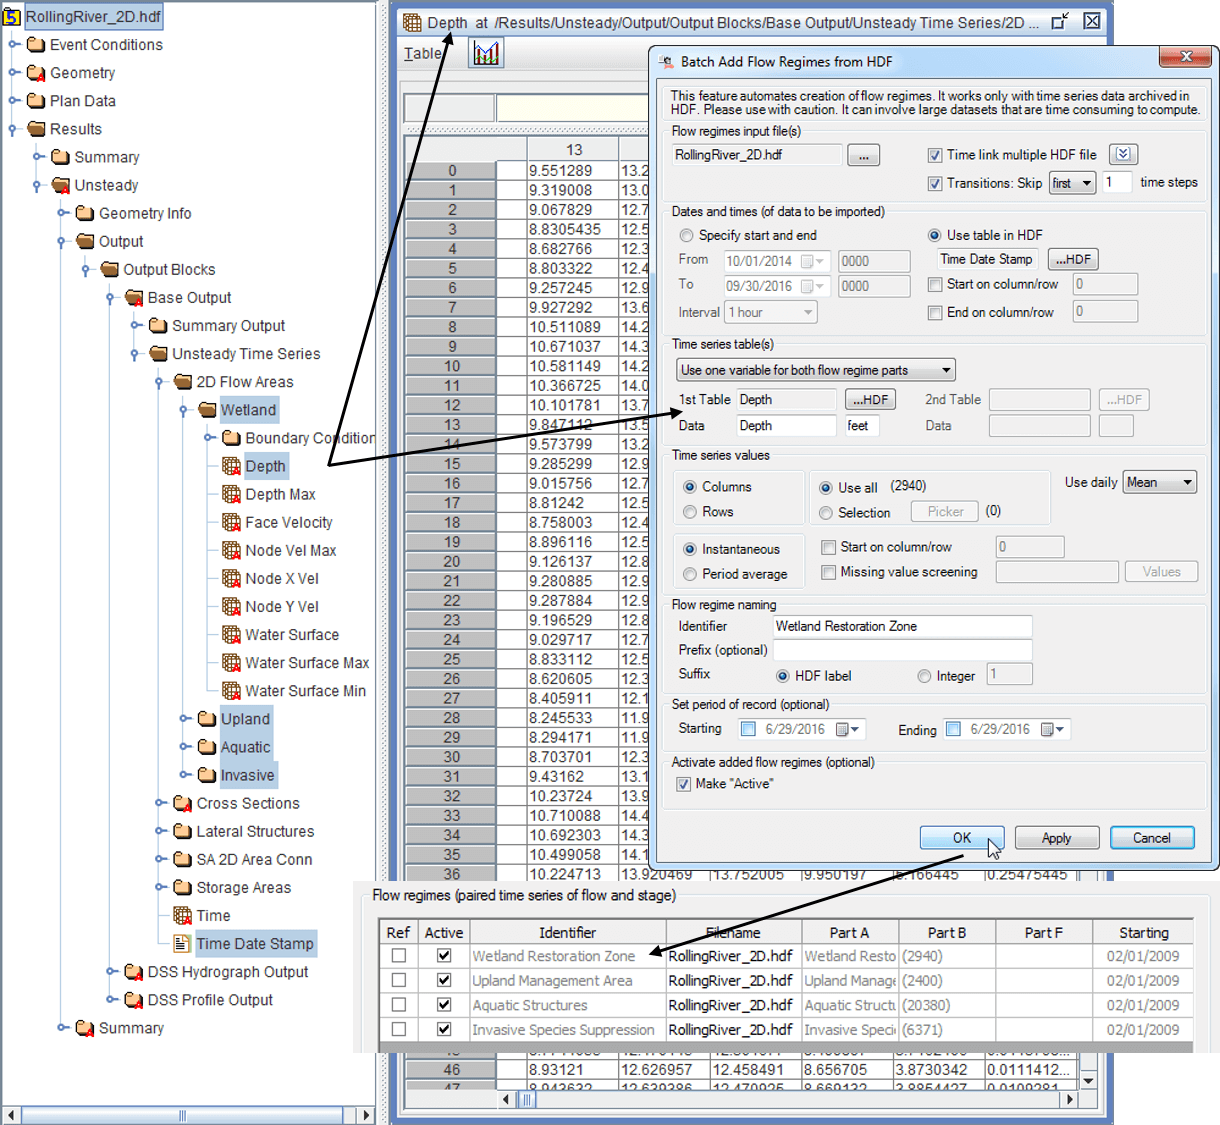
HEC-EFM results are displayed as attributes of a layer of two-dimensional elements (see figure below).